Best AI Data Analysis Tools in 2026: 8 Tools Compared

- Julius AI is our pick for most analysts who want chat-based analysis, with spreadsheet uploads, charts and code transparency in one tool.
- Tableau and Power BI suit teams that need governed dashboards at scale, with AI features layered onto proven visualisation platforms.
- Akkio and Polymer suit non-technical users who want predictions and dashboards without writing code, while ThoughtSpot suits search-driven analytics.
- AI analysis can err, so always check AI outputs against source data, especially for numbers that drive decisions, budgets or public claims.
Quick comparison
| Product | Ideal for | Price from | Free version | |
|---|---|---|---|---|
 Julius AI | Chat-based spreadsheet analysis | See website | Yes | Visit |
 Tableau | Governed enterprise dashboards | See website | No | Visit |
 Microsoft Power BI | Microsoft ecosystem analytics | See website | Yes | Visit |
 Polymer | No-code dashboards | See website | No | Visit |
 Akkio | No-code predictions | See website | No | Visit |
 DataLab | Collaborative data notebooks | See website | No | Visit |
 Luzmo | Embedded dashboards | See website | No | Visit |
 ThoughtSpot | Search-driven analytics | See website | No | Visit |
The best ai data analysis tools
AI data analysis tools split into chat analysts that answer questions about a file, dashboard platforms with AI features, and no-code prediction tools. The right choice depends on whether you analyse a spreadsheet today or run governed dashboards for a whole company. We compared data sources, analysis methods, visualisation, sharing and pricing.
Julius AI
Ideal for: Chat-based spreadsheet analysis
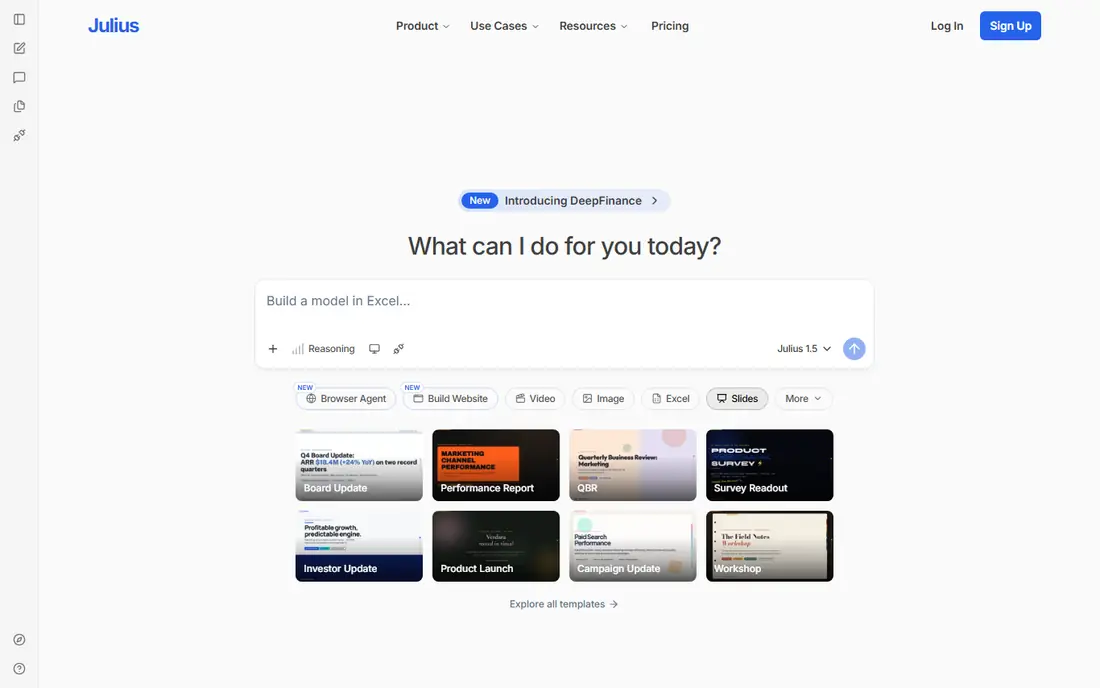
Julius AI suits analysts with a spreadsheet and a question. Upload a CSV or Excel file, ask in plain language, and Julius produces charts, summaries, forecasts and tables, with code shown so you can check how the answer was built. That transparency matters, since it lets you verify a calculation instead of trusting a black-box number.
The limit is governance. Julius excels at ad hoc file analysis, but it is not a governed dashboard platform for hundreds of users with row-level permissions. For a solo analyst, a small team or a one-off investigation, Julius is the fastest path from question to chart.
- Chat with spreadsheets and data files
- Charts, summaries and code shown for checking
- Fast answers for ad hoc questions
- Best for file-based analysis rather than governed enterprise dashboards
- Heavy use needs paid plans
Tableau
Ideal for: Governed enterprise dashboards
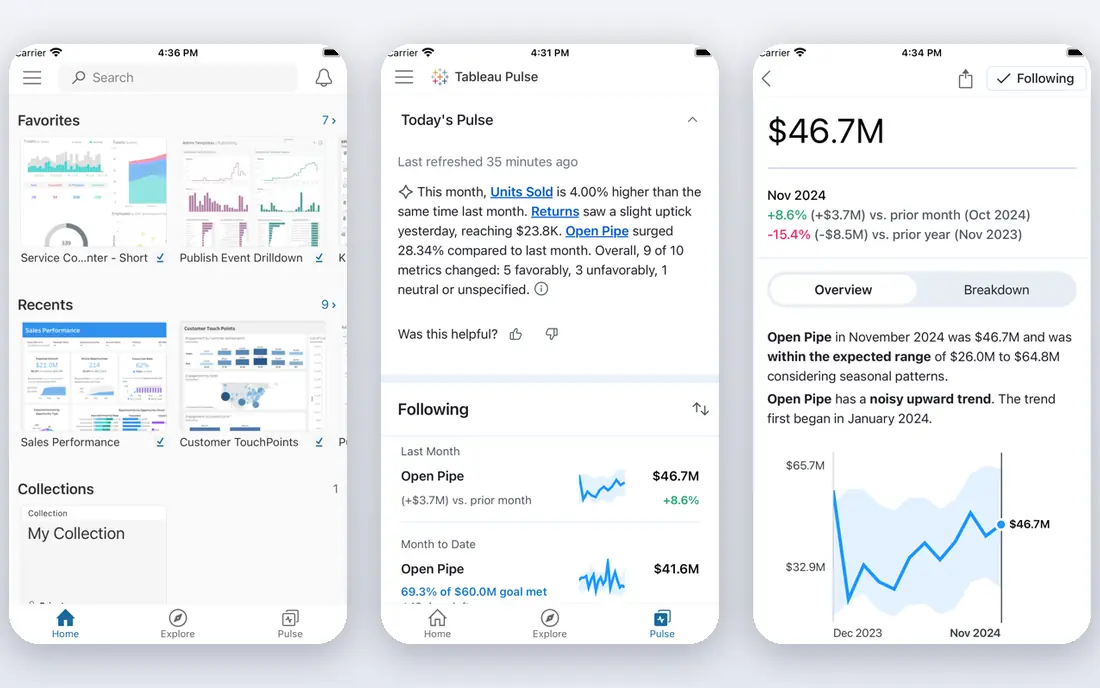
Tableau suits organisations that need trusted dashboards at scale. Its visualisation depth, data preparation and governance tools support hundreds of users, while AI features add natural language queries, explanations for changes and automated insights on top of governed data. That combination keeps AI answers tied to approved metrics.
The weakness is cost and complexity. Tableau licensing is enterprise priced, and building governed dashboards needs trained analysts, so a small team may find Julius or Polymer faster. Tableau fits a company where dashboard trust and scale matter more than ad hoc chat speed.
- Powerful visualisation and dashboarding
- AI features for explanations and natural language queries
- Strong enterprise governance
- Pricing and learning curve are high
- AI features sit on top of a complex platform
Microsoft Power BI
Ideal for: Microsoft ecosystem analytics
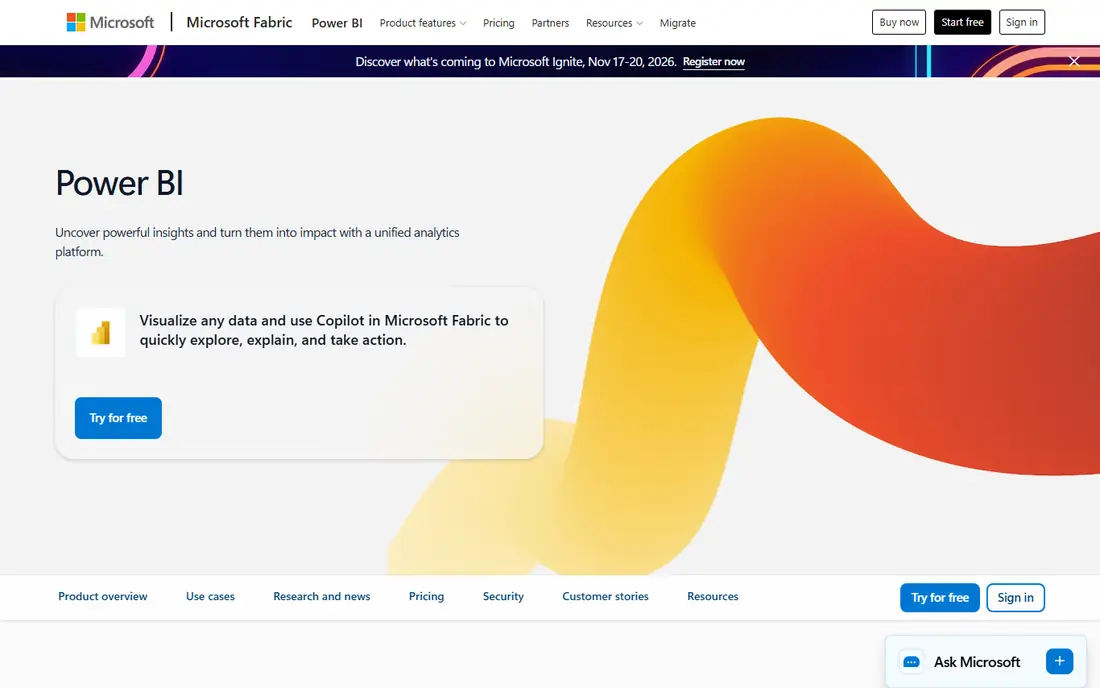
Microsoft Power BI suits teams already on Microsoft 365. Its desktop tool is free for building reports, its service shares dashboards across the organisation, and Copilot AI features help summarise data, suggest visuals and answer questions in natural language. That Microsoft fit makes adoption easy for Excel-heavy teams.
The catch is licensing for sharing. Viewing and collaborating on shared dashboards needs paid per-user licences, and Copilot features vary by tier, so price the sharing model, not just the free desktop tool. Power BI fits Microsoft shops that want governed dashboards with AI help.
- Deep Microsoft 365 and Azure integration
- Copilot AI features for summaries and queries
- Free desktop tool for building reports
- Full sharing and collaboration need paid per-user licences
- AI features vary by licence tier
Polymer
Ideal for: No-code dashboards
Polymer suits small teams that want dashboards without a data team. Connect a spreadsheet or database, and Polymer builds interactive dashboards with AI insights, blocks and filters, without writing code or SQL. That speed helps a startup or agency that needs a client dashboard this week, not after a data project.
The limit is enterprise depth. Polymer governance, permissions and modelling trail Tableau and Power BI, so a large organisation with strict data controls will need a bigger platform. For a small team that needs clear dashboards fast, Polymer is a strong pick.
- No-code dashboards from spreadsheets and databases
- AI insights and block building
- Fast setup for small teams
- Less suited to enterprise governance than Tableau or Power BI
- Advanced modelling needs other tools
Akkio
Ideal for: No-code predictions
Akkio suits business users who want predictions, not just charts. Upload data, and Akkio builds models for churn, sales forecasting, lead scoring and similar questions, with chat features that explain results in plain language. That no-code approach lets a marketing or sales team test a prediction without hiring a data scientist.
The catch is data discipline. Predictions are only as good as the training data, so messy, biased or tiny datasets produce confident-looking but wrong forecasts. Akkio fits a team with clean historical data and a clear prediction question, who will validate results before acting on them.
- No-code machine learning for predictions and forecasting
- Chat with data
- Good fit for business users without coding
- Prediction quality depends on data quality
- Enterprise governance trails larger platforms
DataLab
Ideal for: Collaborative data notebooks
DataLab suits data teams that work in notebooks. Its collaborative environment combines Python, SQL and AI assistance, so analysts can explore data, build models and share notebooks with teammates in one place. That code-first workflow appeals to teams that already analyse in Python and want AI help inside the notebook.
The weakness is business-user fit. Non-technical users will find DataLab harder than Julius or Polymer, and dashboard sharing trails dedicated BI platforms. DataLab fits a technical team that wants AI inside its existing notebook workflow.
- Collaborative notebooks with AI assistance
- Python and SQL workflows
- Good fit for data teams that code
- Needs coding skills for full value
- Dashboard sharing is thinner than Tableau or Power BI
Luzmo
Ideal for: Embedded dashboards
Luzmo suits SaaS teams that embed dashboards inside their own product. Instead of building charts from scratch, a product team can embed Luzmo dashboards that customers filter and explore, with branding and permissions handled by the platform. That embedded focus saves product teams months of chart work.
The limit is internal BI scope. Luzmo leads on embedded customer analytics, but internal enterprise governance and modelling trail Tableau and Power BI. For a SaaS product that must show customers their data beautifully, Luzmo is a strong specialist pick.
- Embedded analytics for SaaS products
- Fast dashboard building
- Good fit for product teams that show data to customers
- Internal BI governance trails Tableau
- Pricing is quote based for larger embedded use
ThoughtSpot
Ideal for: Search-driven analytics
ThoughtSpot suits business users who want to ask questions like a search engine. Type a question about sales, customers or products, and ThoughtSpot returns a chart or table from governed data, with AI features that suggest follow-ups and explain changes. That search style lowers the barrier for non-analysts who need answers daily.
The catch is data preparation. ThoughtSpot works best when data is clean and modelled, which needs data team effort upfront, and pricing is enterprise oriented. ThoughtSpot fits a larger organisation that wants self-service analytics for many business users on trusted data.
- Search-like questions for business users
- AI answers with visualisations
- Governed metrics for teams
- Enterprise pricing and setup effort
- Needs clean, modelled data for best results
How we picked these
We compared data sources, analysis methods, visualisation depth, sharing, governance and pricing for tools still operating in October 2026. We kept chat analysts, dashboard platforms, no-code predictors and embedded tools in the list, since data analysis jobs differ widely. We did not run a benchmark analysis, and we did not repeat vendor accuracy claims as measured facts.
What to check before you buy
Start with data privacy. Never upload sensitive personal, health or financial data to an AI tool without checking its data retention, training and security terms, and prefer tools that promise not to train on your data for business use. For regulated data, keep analysis inside a governed platform such as Tableau or Power BI rather than a consumer chat tool.
Next, verify every important number. AI tools can misread columns, mishandle dates, invent categories or produce plausible but wrong calculations, so check totals against source data, inspect the code or steps where shown, and rerun key analyses with a second method. A chart that looks polished is not proof that the maths is right.
Finally, match the tool to the audience. A solo analyst needs Julius speed, a small team needs Polymer dashboards, a SaaS product needs Luzmo embedding, and a large company needs Tableau or Power BI governance. Buying an enterprise platform for a one-off spreadsheet question wastes money, while using a chat tool for company-wide reporting risks inconsistent numbers.
Frequently asked questions
What is the best AI data analysis tool?
Julius AI is our pick for most analysts who need chat-based spreadsheet analysis. Tableau and Power BI suit governed enterprise dashboards, Akkio and Polymer suit no-code users, and ThoughtSpot suits search-driven business analytics.
Can AI analyse my spreadsheet accurately?
Often yes for clean, well-structured data, but AI can err on messy data, dates, categories and calculations. Always check totals, inspect code or steps where available, and validate important results against source data before acting on them.
Is my data safe with AI analysis tools?
It depends on the tool terms. Check data retention, training use, encryption and compliance claims before uploading sensitive data, and prefer governed platforms for regulated data. Never upload personal data you do not have permission to share.
Do I need to know SQL or Python for AI data tools?
No, for chat and no-code tools such as Julius, Polymer and Akkio, which accept plain language questions. DataLab and advanced Tableau or Power BI work benefit from SQL or Python skills, but business users can start with chat and dashboard tools without coding.
What is the difference between Julius AI and Tableau?
Julius AI answers ad hoc questions about a file through chat, while Tableau builds governed dashboards for many users from connected data sources. Use Julius for a quick investigation, and Tableau or Power BI for trusted, repeatable company reporting.