Top 6 AI Data Visualization Tools for 2026, Compared

- 1
 LuzmoEmbedding AI analytics inside a customer-facing productVisit
- 2
 Microsoft Power BITeams already using Microsoft 365 and FabricVisit
- 3
 TableauGoverned enterprise dashboards with AI helpVisit
- 4
 Julius AIFast analysis and charts from spreadsheets and filesVisit
- 5
 AkkioAI workflows that combine chat, prediction and reportingVisit
- Luzmo is the opening pick, best for Embedding AI analytics inside a customer-facing product.
- What to know about Luzmo first: built for product teams, not for internal-only BI.
- Pricing across the list, from Luzmo to Rows, is by quote only.
- Rows suits AI-powered spreadsheets and live reports.
Direct answer
Luzmo leads the list, best for Embedding AI analytics inside a customer-facing product. Microsoft Power BI is better for teams already using Microsoft 365 and Fabric, and Tableau is better for governed enterprise dashboards with AI help. Prices, free plans and limits for all 6 tools follow.
Quick comparison
| Product | Ideal for | Price from | Free version | |
|---|---|---|---|---|
| Luzmo | Embedding AI analytics inside a customer-facing product | See website | Free trial | Visit |
| Microsoft Power BI | Teams already using Microsoft 365 and Fabric | See website | Yes | Visit |
| Tableau | Governed enterprise dashboards with AI help | See website | Free trial | Visit |
| Julius AI | Fast analysis and charts from spreadsheets and files | See website | Yes | Visit |
| Akkio | AI workflows that combine chat, prediction and reporting | See website | Free trial | Visit |
 Rows | AI-powered spreadsheets and live reports | See website | Yes | Visit |
Our 6 AI data visualization tools
This Ainotely guide covers 6 AI data visualization tools. Each profile lists a starting price, free plan details, strengths and drawbacks, so you can drop poor fits quickly.
Luzmo
Ideal for: Embedding AI analytics inside a customer-facing product

For Embedding AI analytics inside a customer-facing product, Luzmo is a natural candidate. For a SaaS company that wants to ship customer analytics without building a BI team, Luzmo saves a large amount of engineering time.
What works well: chat or agent surface.
The main drawbacks: Pricing needs a pricing page check; not for internal-only BI.
Its AI layer keeps answers consistent with the metrics the company already defines. Worth adding: a customer can ask a question in plain language and receive a visual answer computed by Luzmo's query engine from governed business logic, instead of a guessed SQL query. Luzmo does not show a starting price in this comparison, so check the vendor site for current pricing. Free options: Free trial.
- Secure multi-tenant embedding
- Natural language questions answered from defined business logic
- Setup needs defining metrics and permissions properly
Microsoft Power BI
Ideal for: Teams already using Microsoft 365 and Fabric

Microsoft Power BI is aimed squarely at teams already using Microsoft 365 and Fabric. Reports built in the free Desktop app can be published to the service, shared in Teams, and embedded in other apps, while Copilot helps produce summaries, suggest visuals and answer questions about a report. Also, licensing is the part to price carefully.
From a buyer's view, for a team that keeps data in Excel, SharePoint or Fabric, that integration removes multiple steps that other tools need. From a buyer's view, individual report building can be free, but publishing and sharing at team scale typically needs Power BI Pro licences or Premium or Fabric capacity. The right mix relies on how plenty of people build compared with only view reports. Pricing for Microsoft Power BI is not stated here, so ask the vendor for current figures. Microsoft Power BI offers a free plan.
Trade-offs to know: Sharing reports broadly normally needs premium licences; Some AI features rely on capacity type.
- Copilot assistance for reports and summaries
- Deep integration with Excel
- Licensing mixes Pro
Tableau
Ideal for: Governed enterprise dashboards with AI help
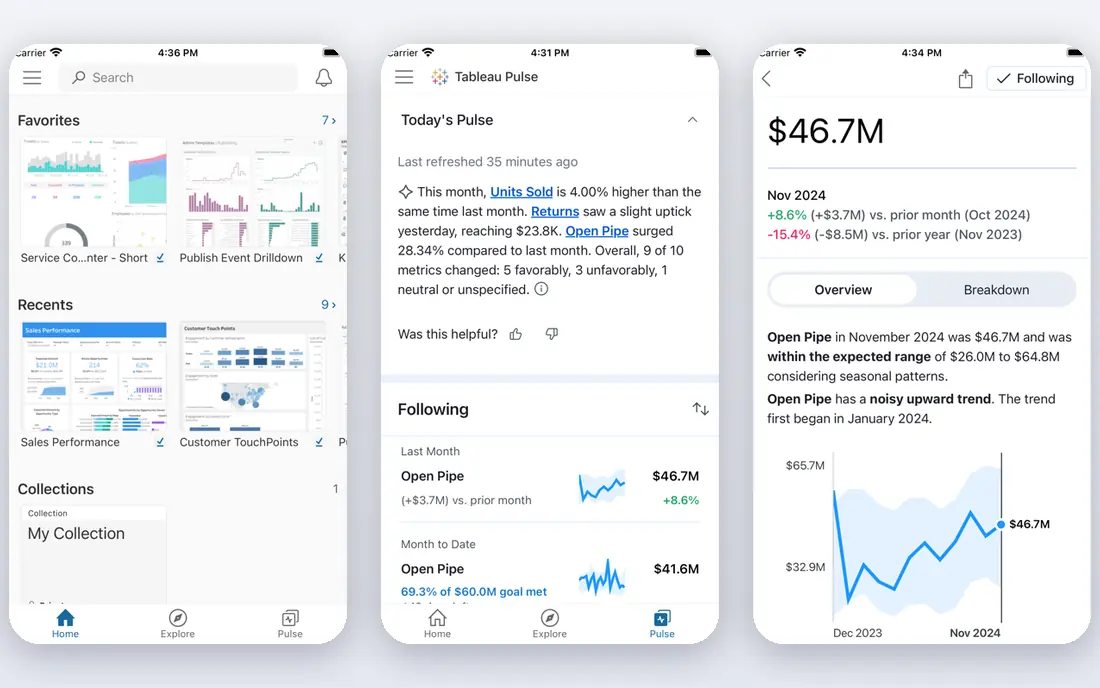
Tableau makes the most sense for governed enterprise dashboards with AI help. Tableau's AI strength is context. The trade-off is enterprise weight.
Users can ask questions in natural language, receive proactive insights, and bring dashboards into Slack, Teams and other tools where decisions happen. From a buyer's view, Tableau Cloud, Server and Next serve different deployment needs. Pricing relies on the product, user type and capacity chosen. As for the details, instead of letting a language model guess at raw tables, Tableau's agentic analytics work from a knowledge engine and semantic layer, so metrics stay consistent when different people ask the same question in different words. This comparison lists no price for Tableau; ask the vendor. Free access: Free trial.
Where it is weaker: Pricing varies by product and deployment, so the pricing page must be checked.
- AI answers in natural language with a semantic layer behind them
- Broad connector range and community resources
- Full enterprise setup takes time
Julius AI
Ideal for: Fast analysis and charts from spreadsheets and files
Julius AI makes the most sense for fast analysis and charts from spreadsheets and files. The limit is governance.
Julius AI is the tool for the question that arrives by email at 4 pm: what drove sales last quarter, and can you chart it for tomorrow's meeting. That speed is valuable for analysts, founders and consultants who work from files instead of from a warehouse. Julius AI shows no starting price here, so confirm the cost on the vendor site. Free access exists with Julius AI.
Downsides: No governed enterprise data model.
- Charts and presentations
- CSV and other files without a BI setup
- Results must be checked, particularly for calculations
Akkio
Ideal for: AI workflows that combine chat, prediction and reporting
Akkio is designed for AI workflows that combine chat, prediction and reporting. That combination fits agencies and operations teams that repeat the same analysis for plenty of clients or campaigns.
Worth adding: if you only need charts from a spreadsheet, a more straightforward tool will be faster and less expensive. Akkio shows no starting price here, so confirm the cost on the vendor site. Trial and free access: Free trial.
Honest limits: Positioning has shifted toward workflow automation, so buyers should trial the current analytics features.
- Governance controls for teams
- Workflows that automate repeat analysis across a business
- Pricing needs a pricing page or sales check
Rows
Ideal for: AI-powered spreadsheets and live reports
Where Rows fits: AI-powered spreadsheets and live reports. Spreadsheets still need care. AI-generated formulas and merged data should be checked, particularly when a report will guide spending or hiring decisions, and very large or heavily governed datasets belong in a BI product.
More specifically, Rows rethinks the spreadsheet as an AI analyst. Rather than wrestling with formulas, a user can ask AI to import data, merge datasets, build a model and chart the result, with live connections that refresh from advertising, social, warehouse and back-office sources. Rows shows no starting price here, so confirm the cost on the vendor site. You can start on Rows without paying.
What users get: Ask AI to build models.
Points against: Pricing for team and AI usage needs a pricing page check.
- Shareable dashboards and embeds
- Charts and reports in a spreadsheet
- Spreadsheet habits can hide errors if formulas are not checked
What went into this list
We compared the tools on published pricing, free plan or trial availability, feature coverage for AI data visualization tools, and the limits each vendor documents. Where a price is missing, the vendor does not list one publicly or ties it to a quote. Always confirm before budgeting. The ranking is editorial: typical fit first, then clear pricing, then free access. If your needs are unusual, read the profiles rather than relying on position.
Before you commit
- Confirm the entry price with every vendor: no tool from Luzmo to Rows shows a fixed starting price.
- Check what the free option really includes: Microsoft Power BI, Julius AI and Rows offer a free plan, and usage caps differ.
- Use real work to test the free trial from Luzmo, Tableau and Akkio, rather than a demo project.
- Before choosing Luzmo, weigh its main limit: aimed at product teams, not for internal-only BI.
- Read the plan comparison for Rows carefully; key features often start on a higher tier.
- Confirm you can export your data from Microsoft Power BI, so leaving later does not mean losing records.
Frequently asked questions
How are the tools for AI data visualization tools ordered?
The order follows typical fit for AI data visualization tools, with Luzmo first and Rows last, then price clarity and free access. It is editorial judgement, not a score, so another team could rank the tools differently.
Are AI-generated charts accurate?
They can be, when the data model is clear and the question is precise. But they can also be wrong when a column name is ambiguous or a filter is misunderstood. Worth adding: always verify numbers that matter.
Is Luzmo the right pick for everyone comparing AI data visualization tools?
No single tool suits every team. Luzmo comes first because it fits Embedding AI analytics inside a customer-facing product, while Microsoft Power BI suits teams already using Microsoft 365 and Fabric and Tableau suits governed enterprise dashboards with AI help. Match the tool to your own size, budget and workflow before deciding.
Do these tools publish their prices?
No. None of the tools, from Luzmo to Rows, shows a fixed starting price here, so budget time for quotes.
Can AI create a chart from a plain-language question?
Yes, most tools here accept a question like sales by region last quarter and return a chart, frequently with a short explanation.
Can I try these options before paying?
Often, yes. Microsoft Power BI, Julius AI and Rows have a free plan and Luzmo, Tableau and Akkio offer a free trial. Use your own data and a real task during the test, and check what the free tier or trial limits before you rely on it.