7 Best Application Performance Monitoring Software Options for 2026

- Dynatrace is the opening pick, best for enterprise automatic root cause.
- Check the limits for Datadog before you commit: per-host plus per-module meters add up quick.
- Free plans exist at 4 of 7 tools (Honeycomb, New Relic, Sentry, Grafana Cloud).
- Grafana Cloud fits open-source stack users.
Direct answer
This list puts Dynatrace first for enterprise automatic root cause. If your case is different, Elastic APM suits search-led observability and Datadog suits all-in-one cloud-native observability. The full list of 7 tools follows, with prices and free plan facts.
Quick comparison
| Product | Ideal for | Price from | Free version | |
|---|---|---|---|---|
 Dynatrace | Enterprise automatic root cause | See website | Free trial (15 days) | Visit |
 Elastic APM | Search-led observability | See website | Free trial | Visit |
 Datadog | All-in-one cloud-native observability | $31 per host/month (APM, billed yearly) | Free trial (14 days) | Visit |
 Honeycomb | Trace-first debugging | $150 a month (Pro plan) | Yes | Visit |
 New Relic | Usage-based product with free ingest | 100 GB/month free, then $0.40 per GB | Yes | Visit |
 Sentry | Developer error tracking plus APM | $26 a month (Team plan, billed annually) | Yes | Visit |
 Grafana Cloud | Open-source stack users | $19 per month (platform fee, plus usage) | Yes | Visit |
Application Performance Monitoring Software compared in detail
Ainotely put together this guide to application performance monitoring software for readers who want a clear shortlist without reading every vendor page. It compares 7 tools on starting price, free plans, who each one suits and where each one falls short.
Dynatrace
Ideal for: Enterprise automatic root cause
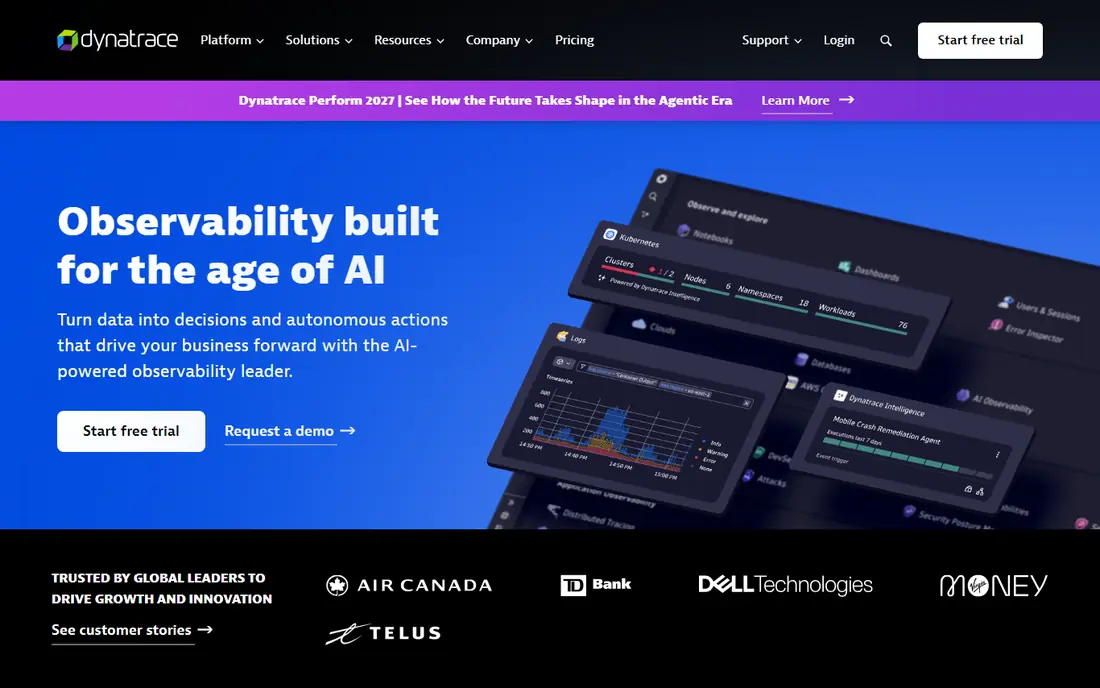
Dynatrace is built with enterprise automatic root cause in mind. Dynatrace is made for large, complicated environments where nobody can draw the system map by hand. Its agent discovers services, hosts and dependencies automatically, and its analysis engine traces problems to a root cause across the full stack rather than handing engineers a pile of charts.
Pricing is quote-led and based on a system subscription measured in host memory and data volume, with published comparisons putting full-stack monitoring around $58 per 8 GB host per month. That is a premium rate, and smaller teams will find better value elsewhere. In daily use, Dynatrace earns its price when the alternative is a long outage investigation across teams that each own part of the system. Dynatrace shows no starting price here, so confirm the cost on the vendor site. Free options: Free trial (15 days).
Where it falls short: Quote-led pricing.
- AI-driven root cause analysis
- Automatic topology mapping
- Premium price for full-stack monitoring
Elastic APM
Ideal for: Search-led observability
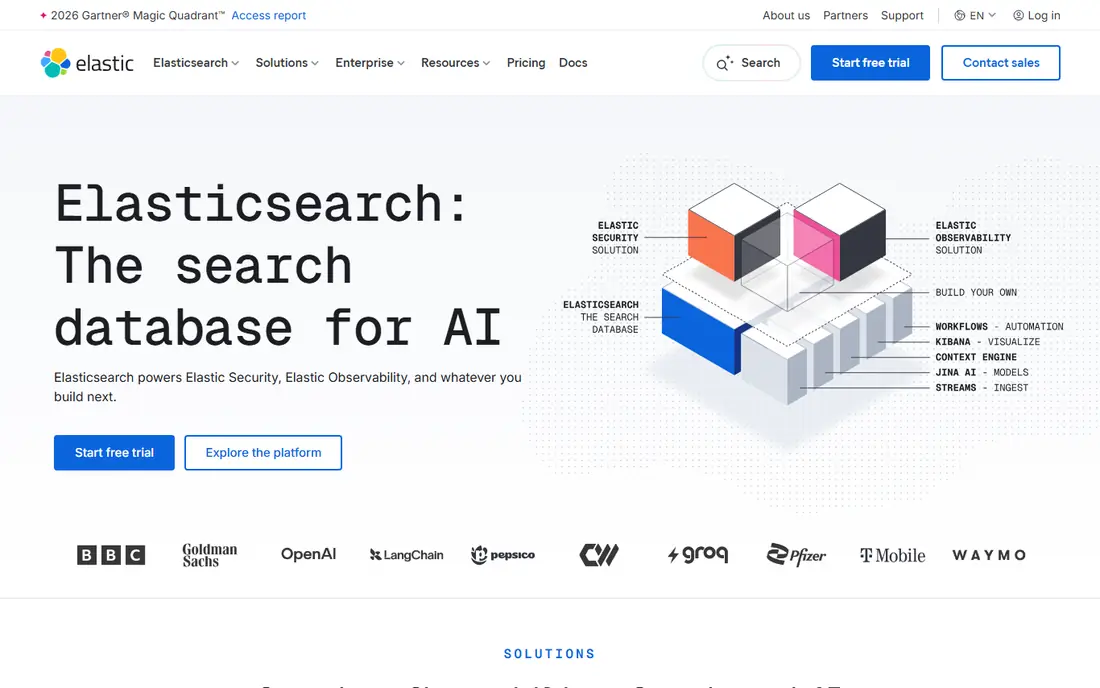
Elastic APM targets search-led observability. Cloud pricing is quote-led and based on deployment size and ingest, with serverless choices priced from around $0.07 per GB ingested in published comparisons. Traces, logs and metrics land in Elasticsearch, where engineers can query across all three with one language rather than learning a separate tool for each signal.
Beyond that, choose Elastic when search is your workflow, not just a feature you might use. On top of that, the open core can be self-hosted at no license cost, which appeals to teams with strict data residency rules or existing Elastic expertise. The honest catch is operational effort: running Elasticsearch, Kibana and the APM server yourself is a real commitment. Many teams end up on Elastic Cloud to avoid it. Elastic APM does not show a starting price in this comparison, so check the vendor site for current pricing. Trial and free access: Free trial.
Where it is weaker: Quote-led cloud pricing.
- Feature-rich search across logs
- Self-hosted choice
- Running the stack yourself takes real effort
Datadog
Ideal for: All-in-one cloud-native observability
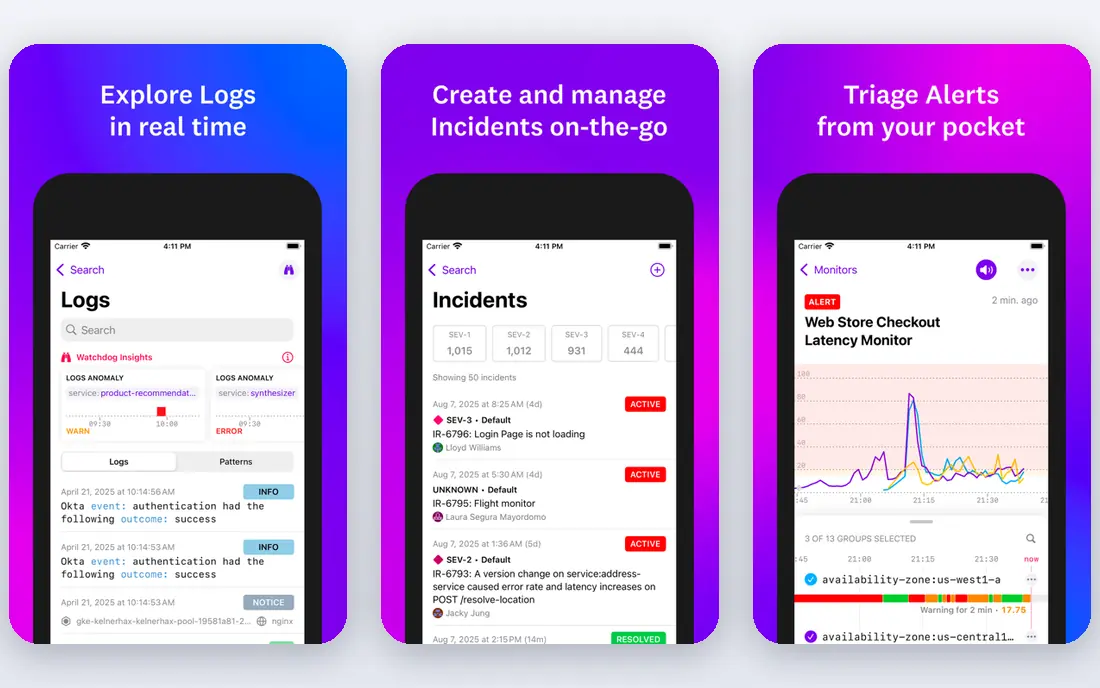
Datadog is a good fit for all-in-one cloud-native observability. APM begins at $31 per host a month on annual billing, with infrastructure monitoring at $15 per host a month, and logs, custom metrics and other modules metered separately.
Limits to weigh: Custom metrics billing needs care.
The starting price for Datadog: $31 per host/month. Trial and free access: Free trial (14 days).
- APM, logs
- Huge integration catalog
- Per-host plus per-module meters add up quick
Honeycomb
Ideal for: Trace-first debugging
Honeycomb makes the most sense for Trace-first debugging. When a bug affects only one customer segment or one version of a service, that query-first approach finds the pattern quicker than drilling through dashboards. As for the details, buy it for debugging depth, not for replacing your entire observability stack.
Also, teams debugging complicated distributed systems rate it highly for exactly that reason. Honeycomb takes a different view of observability: rather than pre-aggregated metrics, it keeps wide events with high-cardinality fields and lets engineers ask new questions on the fly. The starting price for Honeycomb: $150 per month. Honeycomb offers a free plan.
The main drawbacks: Pro plan starts at $150 a month.
- Quick ad-hoc queries
- Very good free level for small teams
- Less infrastructure monitoring than all-in-one rivals
New Relic
Ideal for: Usage-based product with free ingest
New Relic is designed for usage-based system with free ingest. The risk runs the other way: verbose logging or unfiltered traces can push ingest well past the free allowance.
The free level bundles 100 GB of data ingest a month and one full system user, with full APM included instead of a cut-down version. From a buyer's view, New Relic suits teams that are willing to run what they ingest, and it is a poor fit for teams that want to log everything and sort it out later. What you pay to start with New Relic: 100 GB/month free, then $0.40 per GB. New Relic offers a free plan.
Drawbacks to consider: Costs rise with log and trace volume.
- Not hosts
- Usage-based pricing scales with data
- Per-user seats on premium plans
Sentry
Ideal for: Developer error tracking plus APM
In short, Sentry is for developer error tracking plus APM. The limit is scope: Sentry does not replace infrastructure monitoring or log management at scale, so bigger organizations normally pair it with a system like Datadog or Grafana instead of relying on it alone. On top of that, Sentry opens from the developer side of the problem.
Drawbacks to consider: Quotas need watching on busy apps.
It captures errors with stack traces, release context and user impact, then layers on performance monitoring for transactions and slow endpoints in the same workflow. On top of that, the Developer plan is free, and the Team plan opens at $26 a month on annual billing. That makes Sentry the cheapest serious APM entry for product teams, particularly those already using it for error tracking. Entry price for Sentry: $26 per month. You can start on Sentry without paying.
- Ample free developer plan
- Quick setup
- Less infrastructure depth than Datadog or Dynatrace
Grafana Cloud
Ideal for: Open-source stack users
In short, Grafana Cloud is for open-source stack users. Premium pricing starts with a $19 a month product fee plus usage meters for series, logs and traces, with published comparisons putting the per-host equivalent around $18 per month.
That is competitive, but the meters reward discipline: high-cardinality metrics raise the series count, and verbose logs raise the GB count. Starting cost for Grafana Cloud: $19 per month. Grafana Cloud includes a free tier.
Downsides: Usage meters for series, logs and traces.
- Open standards and open-source core
- Capable free level
- Assembling the stack takes configuration
How we compared the tools
Pricing pages, product documentation and feature lists were the main sources, and every entry carries at least one honest drawback. Treat prices as a snapshot: vendors change plans often, so check the vendor site for the figure that applies today. We ordered the tools by general fit, then by how clearly pricing is shown, then by free access. A buyer with unusual needs may reorder them.
Things to verify first
- Get a written quote from Dynatrace and Elastic APM; the list shows no starting price for them.
- Check what the free option really includes: Honeycomb, New Relic, Sentry and Grafana Cloud offer a free plan, and usage caps differ.
- Run a trial of Dynatrace, Elastic APM and Datadog with real work before paying for a year; your own workflow is the best test.
- Read the limits listed for Dynatrace first: quote-led pricing.
- Work out what Datadog costs with your real seat count, add-ons and usage, not just the entry price.
- Look at the help docs and support options for New Relic before you commit.
Frequently asked questions
What is OpenTelemetry and why does it matter?
Using it means your instrumentation is portable, so switching APM vendors later does not need rewriting every service.
What is application performance monitoring software?
APM software tracks how an application behaves in production: response times, error rates, throughput and the traces that present how a request moves across services.
What is the cheapest option for application performance monitoring software in this list?
On published monthly entry prices, Grafana Cloud is the lowest here at $19 per month. Entry price is only part of the cost, because seats, add-ons and billing terms can change the total.
Can I try these options before paying?
Often, yes. Honeycomb, New Relic, Sentry and Grafana Cloud have a free plan and Dynatrace, Elastic APM and Datadog offer a free trial. Use your own data and a real task during the test, and check what the free tier or trial limits before you rely on it.
How are the tools for application performance monitoring software ordered?
The order follows typical fit for application performance monitoring software, with Dynatrace first and Grafana Cloud last, then price clarity and free access. It is editorial judgement, not a score, so another team could rank the tools differently.
Do these tools publish their prices?
Not all of them. Dynatrace and Elastic APM publish no starting price, so expect a quote request for those. The rest, Datadog included, show a starting price, though seats and billing terms still change the final cost.