Best Cloud Analytics Platforms in 2026: 7 Platforms Compared

- 1
 TableauVisual analytics and dashboardsVisit
- 2
 Microsoft Power BIBest value for Microsoft usersVisit
- 3
 LookerGoverned analytics for data teamsVisit
- 4
 SnowflakeWarehouse plus analyticsVisit
- 5
 Amazon QuickSightLow cost AWS analyticsVisit
- Self service tools suit business teams, while data science platforms suit teams with analysts and engineers.
- Check which data sources connect natively, since manual imports slow reporting.
- AI features help summarize and forecast, but they still need clean, trusted data.
- Per user pricing can grow fast, so count viewers as well as creators when you budget.
Quick comparison
| Product | Ideal for | Price from | Free version | |
|---|---|---|---|---|
| Tableau | Visual analytics and dashboards | See website | No | Visit |
| Microsoft Power BI | Best value for Microsoft users | See website | Yes | Visit |
| Looker | Governed analytics for data teams | See website | No | Visit |
| Snowflake | Warehouse plus analytics | See website | No | Visit |
| Amazon QuickSight | Low cost AWS analytics | See website | No | Visit |
 Sisense | Embedded analytics | See website | No | Visit |
 Databricks | Analytics plus AI on one platform | See website | No | Visit |
The best cloud analytics platforms
Cloud analytics platforms turn data from many sources into dashboards, reports, and forecasts, and the best choice depends on whether your team needs self service dashboards, deep data science, or both.
We compared dashboard quality, data connections, AI features, and pricing across leading platforms, and our pick for most teams is a platform that business users can use without waiting on engineers for every report.
In this guide, we walk through each option in turn, starting with who it suits best, then looking at what it does well and where it falls short, so you can compare like with like. We also cover pricing in plain terms, including where a price is quote based or where a free plan covers only part of the service, because the headline price rarely tells the full story. By the end, you should have a short list of two or three options worth a closer look, rather than a long list of names with no clear differences.
Tableau
Ideal for: Visual analytics and dashboards
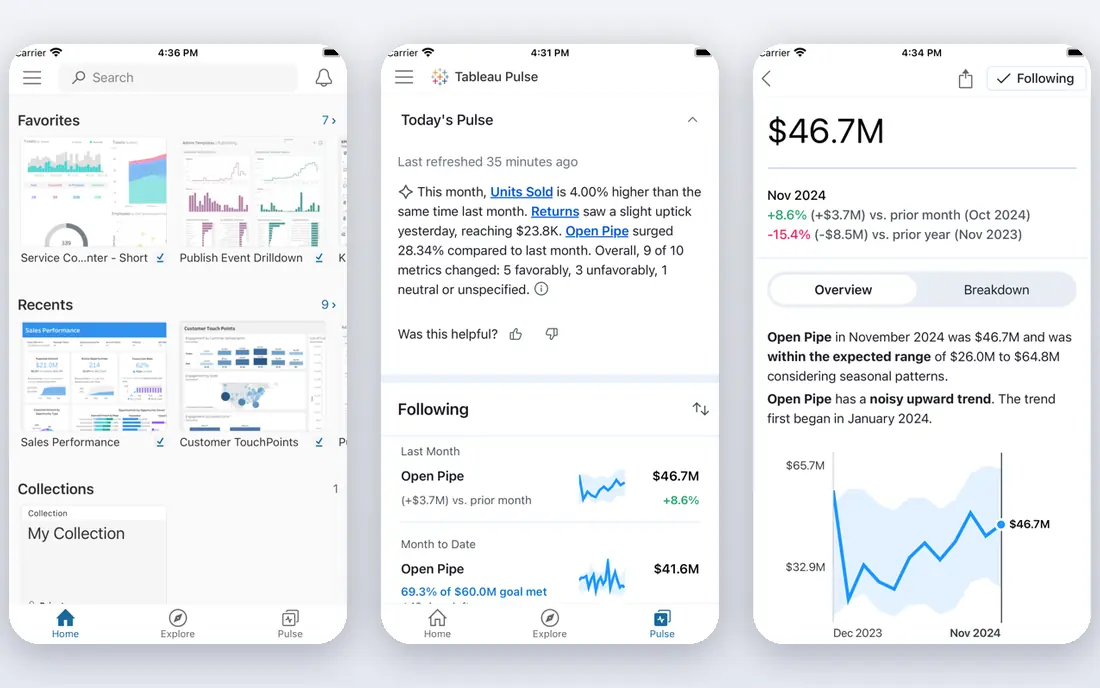
Tableau is a leading visual analytics platform known for polished dashboards and flexible charting. Its connector library covers databases, warehouses, and SaaS apps, so teams can combine sources in one view.
The community and learning resources are large, which helps new users build skills quickly. For presentation quality dashboards, Tableau remains a top choice.
Pricing is high, especially for creators, and advanced features take time to learn.
On balance, Tableau stands out for Visual analytics and dashboards, with strengths that include Excellent visuals; strong community; many connectors. The main drawbacks to weigh are Pricing is high; learning curve for advanced use. If those trade offs fit your situation and your budget, it is worth putting on your short list, and if they do not, compare it with the next options in this guide before you decide, since a small difference in price, coverage, or support can matter a lot over a year of use.
- Excellent visuals
- Strong community
- Many connectors
- Pricing is high
- Learning curve for advanced use
Microsoft Power BI
Ideal for: Best value for Microsoft users
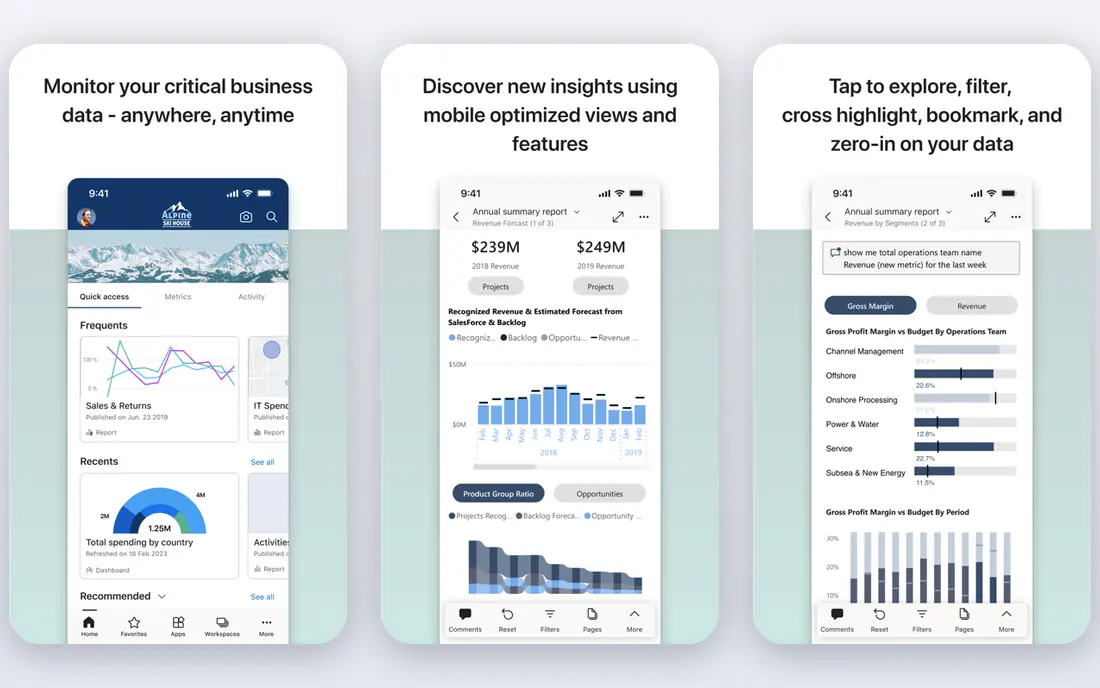
Microsoft Power BI is a strong value pick, especially for teams already using Microsoft 365 and Azure. Its dashboards and reports are capable, and integration with Excel, Teams, and Azure is deep.
A free desktop version lets individuals build reports before buying a team plan. For Microsoft centered companies, it is often the obvious choice.
It works best inside the Microsoft stack, and the full desktop authoring experience is Windows focused.
On balance, Microsoft Power BI stands out for Best value for Microsoft users, with strengths that include Low cost; Microsoft integrations; strong dashboards. The main drawbacks to weigh are Best on Microsoft stack; desktop is Windows focused. If those trade offs fit your situation and your budget, it is worth putting on your short list, and if they do not, compare it with the next options in this guide before you decide, since a small difference in price, coverage, or support can matter a lot over a year of use.
- Low cost
- Microsoft integrations
- Strong dashboards
- Best on Microsoft stack
- Desktop is Windows focused
Looker
Ideal for: Governed analytics for data teams
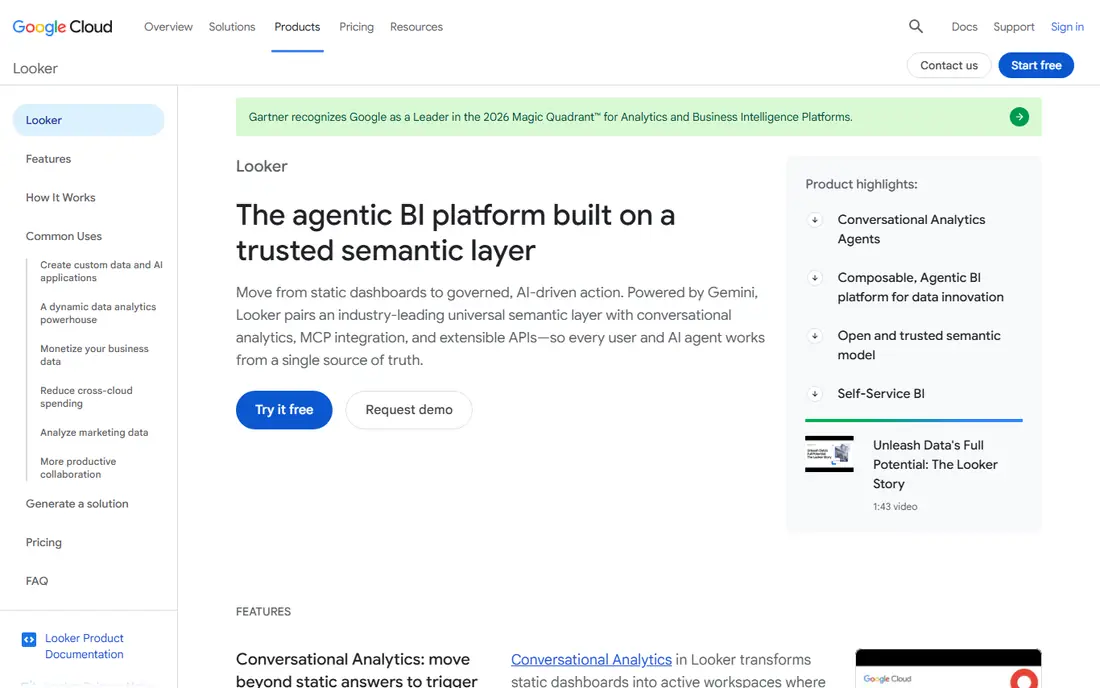
Looker, now part of Google Cloud, suits data teams that want governed, modeled analytics with consistent definitions. Its modeling layer lets teams define metrics once, so every dashboard uses the same numbers.
Governance and permissions are strong, which helps larger organizations avoid conflicting reports. Integration with BigQuery and Google Cloud is deep.
It needs a data team to model well, and pricing is quote based, so smaller teams may prefer a simpler tool.
On balance, Looker stands out for Governed analytics for data teams, with strengths that include Strong data modeling; governance; Google Cloud fit. The main drawbacks to weigh are Needs data team; pricing is quote based. If those trade offs fit your situation and your budget, it is worth putting on your short list, and if they do not, compare it with the next options in this guide before you decide, since a small difference in price, coverage, or support can matter a lot over a year of use.
- Strong data modeling
- Governance
- Google Cloud fit
- Needs data team
- Pricing is quote based
Snowflake
Ideal for: Warehouse plus analytics
Snowflake appears here as a warehouse that powers analytics, since many teams run dashboards on top of it through partner BI tools. Its scaling and data sharing suit companies with large or shared data sets.
Teams can connect Tableau, Power BI, Looker, and other tools to the same warehouse. That flexibility lets each team use its preferred dashboard tool.
Snowflake is not a standalone dashboard tool, so budget for a BI product as well, and watch query costs.
On balance, Snowflake stands out for Warehouse plus analytics, with strengths that include Scales well; partner BI tools; data sharing. The main drawbacks to weigh are Not a standalone BI tool; costs vary. If those trade offs fit your situation and your budget, it is worth putting on your short list, and if they do not, compare it with the next options in this guide before you decide, since a small difference in price, coverage, or support can matter a lot over a year of use.
- Scales well
- Partner BI tools
- Data sharing
- Not a standalone BI tool
- Costs vary
Amazon QuickSight
Ideal for: Low cost AWS analytics
Amazon QuickSight suits teams on AWS who want low cost analytics without per user fees for occasional viewers. Its pay per session pricing can keep costs down for dashboards viewed infrequently.
Integration with AWS data sources is straightforward, and setup is fast. Machine learning insights add forecasting and anomaly detection.
The community is smaller than Tableau or Power BI, and advanced visual options are fewer.
On balance, Amazon QuickSight stands out for Low cost AWS analytics, with strengths that include Low pay per session pricing; AWS integrations; fast setup. The main drawbacks to weigh are Smaller community; fewer advanced visuals. If those trade offs fit your situation and your budget, it is worth putting on your short list, and if they do not, compare it with the next options in this guide before you decide, since a small difference in price, coverage, or support can matter a lot over a year of use.
- Low pay per session pricing
- AWS integrations
- Fast setup
- Smaller community
- Fewer advanced visuals
Sisense
Ideal for: Embedded analytics
Sisense is a strong pick for companies that embed analytics inside their own product or customer portal. Its engine handles large data sets, and customization options suit product teams.
Embedded dashboards can be white labeled, which matters for customer facing analytics. The platform also serves internal business intelligence teams.
Pricing is quote based, and setup needs care to get the most from its customization.
On balance, Sisense stands out for Embedded analytics, with strengths that include Strong embedding; handles large data; good customization. The main drawbacks to weigh are Pricing is quote based; setup needs care. If those trade offs fit your situation and your budget, it is worth putting on your short list, and if they do not, compare it with the next options in this guide before you decide, since a small difference in price, coverage, or support can matter a lot over a year of use.
- Strong embedding
- Handles large data
- Good customization
- Pricing is quote based
- Setup needs care
Databricks
Ideal for: Analytics plus AI on one platform
Databricks suits teams that combine analytics with machine learning, since both run on the same lakehouse platform. Its dashboards and SQL tools cover reporting, while notebooks and AI features cover deeper analysis.
Data pipelines and governance are built in, reducing tool sprawl. For data led companies, that combination is a real advantage.
Business only teams may find it complex, and usage based pricing needs monitoring.
On balance, Databricks stands out for Analytics plus AI on one platform, with strengths that include Lakehouse design; AI features; strong pipelines. The main drawbacks to weigh are Complex for business only teams; usage pricing. If those trade offs fit your situation and your budget, it is worth putting on your short list, and if they do not, compare it with the next options in this guide before you decide, since a small difference in price, coverage, or support can matter a lot over a year of use.
- Lakehouse design
- AI features
- Strong pipelines
- Complex for business only teams
- Usage pricing
How we picked these
We compared official feature pages, pricing pages, app store listings, privacy policies, and public customer reviews for each option in this list, and we kept only options that are available in the United States and that clearly fit the topic of the article.
We gave weight to clear pricing, a usable free option or trial where one is offered, honest limits, and support that a real customer can reach, and we left out options whose pricing was hidden, whose main offer did not match the topic, or whose website did not clearly belong to the product.
We also checked that each product is still offered and working in October 2026, and we noted where a feature, a plan, or a price could not be verified from the vendor, in which case we wrote See website rather than guessing. That approach means some prices in this guide are deliberately general, and we recommend confirming the current price on the vendor website before you buy, since plans and promotions change.
How to choose a cloud analytics platform
Start with the people who will use it, because a platform built for data scientists will frustrate business users, and a simple dashboard tool will limit analysts. Ask who creates reports, who only views them, and how often data must refresh.
Next, test connections to your real sources, including your warehouse, CRM, and spreadsheets, and build one real dashboard during the trial. That test reveals more than a feature list.
Finally, model pricing for creators plus viewers, and check governance features such as permissions, data definitions, and audit logs. A platform that grows without governance quickly fills with conflicting reports.
Frequently asked questions
What is the best cloud analytics platform?
It depends on your team, since business teams often prefer self service dashboard tools, while data teams prefer platforms that combine warehousing and machine learning. Match the tool to the people who will build and use reports daily.
Do I need a data warehouse first?
Not always, since many analytics tools connect directly to apps and spreadsheets, but a warehouse helps when you combine many sources or large volumes. Start with direct connections, and add a warehouse as data grows.
What is the difference between BI and analytics platforms?
Business intelligence tools focus on dashboards and reports from historical data, while broader analytics platforms may add forecasting, machine learning, and data preparation. Many modern platforms now cover both.
How much do cloud analytics platforms cost?
Pricing varies by users, data volume, and features, with free tiers for small teams and enterprise pricing for large ones. Count viewers as well as creators, since viewer fees can dominate the total.
Can non technical users build dashboards?
Yes, most modern platforms offer drag and drop dashboard builders, but clean data and clear definitions still matter. Training and a few starter dashboards help business users succeed.