Best Dashboard Reporting Tools in 2026: 8 Tools Compared

- Tableau and Power BI suit deep business intelligence, with Tableau leaning to visual analysis and Power BI to Microsoft ecosystems.
- Looker Studio and Metabase suit free or low-cost dashboards, with Looker Studio leaning to Google data and Metabase to self-hosted databases.
- Databox and Klipfolio suit marketing and KPI dashboards, with Databox leaning to ready metrics and Klipfolio to custom metrics.
- Domo and Zoho Analytics suit all-in-one platforms, with Domo leaning to enterprise and Zoho Analytics to small business value.
Quick comparison
| Product | Ideal for | Price from | Free version | |
|---|---|---|---|---|
 Tableau | Visual business intelligence | See website | Yes | Visit |
 Power BI | Microsoft business intelligence | See website | Yes | Visit |
 Looker Studio | Free Google dashboards | Free | Yes | Visit |
 Metabase | Open-source dashboards | See website | Yes | Visit |
 Databox | Marketing KPI dashboards | See website | Yes | Visit |
 Klipfolio | Custom KPI dashboards | See website | Yes | Visit |
 Domo | Enterprise data platform | See website | No | Visit |
 Zoho Analytics | Small business analytics | See website | Yes | Visit |
The best dashboard reporting tools
We compared official feature pages, pricing pages, and app listings to find dashboard tools with real data connections, clear visualizations, and reporting features that work in October 2026.
Tableau
Ideal for: Visual business intelligence
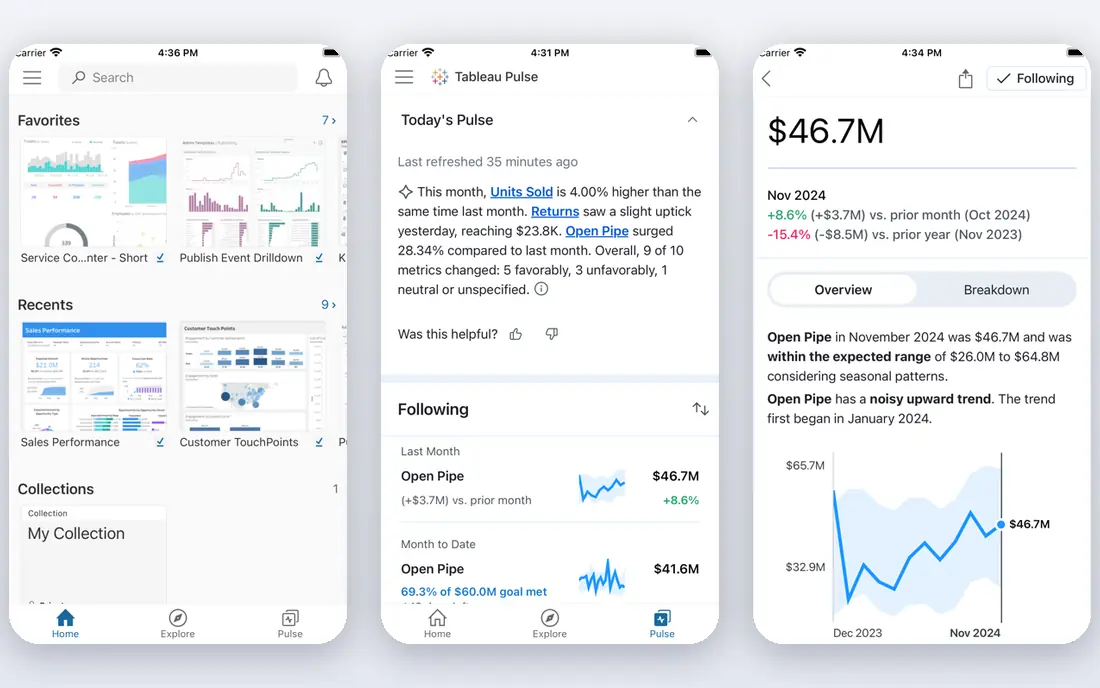
Tableau is a leading business intelligence tool for visual analysis, letting users drag fields onto a canvas to build charts, dashboards, and stories from data. Its connector library covers databases, spreadsheets, and cloud apps, and its community offers templates and help for common analyses. That visual power suits analysts who need to explore data, not just display fixed metrics.
The price is high for small teams, and advanced features take time to learn. A free public version exists for non-private work, while business use needs a paid plan. Still, for deep visual analysis, Tableau is our pick.
- Powerful visual analysis
- Many data connectors
- Large community
- Price is high for small teams
- Learning curve for advanced features
Power BI
Ideal for: Microsoft business intelligence
Power BI, from Microsoft, integrates tightly with Excel, Teams, and Azure, making it a natural choice for organizations already using Microsoft 365. The desktop version is affordable for building reports, and AI insights help surface trends without manual analysis. Dashboards can be shared across a company with governance and refresh controls.
Sharing and collaboration need paid plans for full use, and the tool works best inside the Microsoft ecosystem. Still, for Microsoft-based teams, Power BI is our pick for value and integration.
- Strong Microsoft integration
- Affordable desktop version
- AI insights
- Best in Microsoft ecosystem
- Sharing needs a paid plan for full use
Looker Studio
Ideal for: Free Google dashboards
Looker Studio, formerly Google Data Studio, offers free dashboards with strong connectors for Google Analytics, Sheets, Ads, and BigQuery. Sharing is easy through Google accounts, and templates speed up common reports for marketing and web analytics. That free, Google-friendly approach suits small teams and agencies that live in Google tools.
Performance can lag on very large datasets, and advanced analytics are fewer than in Tableau or Power BI. Still, for a free dashboard tool with Google data, Looker Studio is our pick.
- Free for core use
- Strong Google data connectors
- Easy sharing
- Performance can lag on large data
- Fewer advanced features than Tableau
Metabase
Ideal for: Open-source dashboards
Metabase is an open-source dashboard tool that lets non-technical users ask questions of a database through a visual builder, without writing SQL. Dashboards and alerts can be shared with a team, and self-hosting gives full control over data and privacy. That open approach suits startups and data teams that want a low-cost, flexible tool.
Advanced features such as permissions and serious scaling need a paid plan, and self-hosting needs technical skill to set up and maintain. Still, for open-source dashboards with an easy builder, Metabase is our pick.
- Open-source version available
- Easy question builder
- Self-hosting option
- Advanced features need a paid plan
- Self-hosting needs technical skill
Databox
Ideal for: Marketing KPI dashboards
Databox focuses on KPI dashboards for marketing, sales, and business metrics, with ready-made metrics and templates for common tools such as Google Analytics, HubSpot, and social platforms. That ready-made approach speeds up setup, since you pick a metric rather than building a query from scratch. Mobile dashboards let managers check key numbers on the go.
Custom analysis is more limited than in Tableau or Power BI, and full features need a paid plan. Still, for marketing KPI dashboards that are live in hours, Databox is our pick.
- Ready-made metrics for marketing
- Many integrations
- Mobile dashboards
- Custom analysis is limited
- Full features need a paid plan
Klipfolio
Ideal for: Custom KPI dashboards
Klipfolio lets users build custom KPI dashboards with formulas, metrics, and visualizations from many data sources. TV and wallboard displays suit offices that want live metrics visible to a whole team. That customization suits businesses with specific KPIs that ready-made templates do not cover.
Custom formulas have a learning curve, and full features need a paid plan. Still, for custom KPI dashboards with live displays, Klipfolio is our pick.
- Custom metrics and formulas
- Many integrations
- TV and wallboard displays
- Learning curve for custom formulas
- Full features need a paid plan
Domo
Ideal for: Enterprise data platform
Domo is an all-in-one data platform that combines connectors, dashboards, AI tools, and apps for enterprise teams. It handles data ingestion, transformation, and visualization in one place, which suits large organizations that want a single platform rather than many tools. Collaboration and mobile access are built in for company-wide use.
There is no free plan, the price is high, and complexity suits larger teams better than small ones. Still, for enterprise data platforms with broad coverage, Domo is our pick.
- All-in-one data platform
- Many connectors
- AI and app tools
- No free plan
- Price is high
- Complexity suits larger teams
Zoho Analytics
Ideal for: Small business analytics
Zoho Analytics offers good value for small businesses, with dashboards, reports, and an AI assistant that helps build visualizations from plain questions. Integration with other Zoho apps suits businesses already using Zoho CRM, Books, or Desk, since data flows between apps without extra connectors. A free tier covers basic use for small teams.
Depth for advanced analysis is less than Tableau, and the interface can feel busy. Still, for small business analytics at a fair price, Zoho Analytics is our pick for value.
- Good value for small business
- AI assistant
- Zoho app integration
- Less depth than Tableau for advanced analysis
- Interface can feel busy
How we picked these
We compared official feature pages, pricing pages, and app listings for dashboard tools live in October 2026. We favored tools with real data connectors, clear visualizations, and sharing or reporting features, rather than simple chart makers. We left out tools with no data connections or no usable free tier or trial, except Domo for enterprise use.
What to check before you choose
Start with your data sources. Google-heavy teams suit Looker Studio, Microsoft teams suit Power BI, database teams suit Metabase, and Zoho users suit Zoho Analytics. A tool without your key connector will need manual exports that quickly become stale.
Next, decide who builds dashboards. Analysts suit Tableau or Power BI, while non-technical managers suit Metabase, Databox, or Zoho Analytics with visual builders and templates. A powerful tool no one can use adds no value.
Finally, check sharing and refresh. Dashboards should update automatically and share securely with the right people, not as static screenshots. Test a live dashboard with real data before committing to a paid plan.
Before you commit to one option, spend a short trial period with your top two choices from this list. Use each one for a real task from your own work or daily routine, not just a demo, and note where you get stuck, what feels slow, and which features you actually open twice. Check the official pricing page again at that point, since free plans and paid tiers change, and confirm that the plan you need covers the users, projects, or devices you will use. Read the privacy and support pages too, especially for tools that hold personal or work data, and confirm how to export your work if you later switch. A tool that fits your routine in a two-week trial is a far better choice than a more powerful option you avoid opening, so let daily use, not a feature list alone, decide your final pick for best dashboard reporting tools.
Frequently asked questions
What is the best dashboard reporting tool overall?
Tableau is our pick for deep visual analysis, while Power BI is our pick for Microsoft teams. Looker Studio suits free Google dashboards, and Metabase suits open-source database dashboards. Pick by your data sources and team skills.
Is there a free dashboard reporting tool?
Yes, Looker Studio is free for core use, and Tableau Public, Power BI Desktop, Metabase, Databox, Klipfolio, and Zoho Analytics all have free tiers. Domo is the exception, with no free plan. Start free and pay for sharing, scale, or advanced features.
Which tool is best for marketing dashboards?
Databox is our pick for ready-made marketing KPIs, while Klipfolio suits custom marketing metrics. Looker Studio also works well for Google Analytics and Ads reporting at no cost. Choose ready metrics for speed and custom metrics for specific KPIs.
Do I need to know SQL to use these tools?
No, most tools here offer visual builders that need no SQL, including Metabase, Looker Studio, Databox, and Zoho Analytics. SQL helps for advanced work in Tableau and Power BI, but it is not required for basic dashboards.
Can dashboards update automatically?
Yes, all eight tools here support scheduled refresh from connected data sources, so dashboards stay current without manual exports. Check refresh limits on free plans, since some plans update less often than paid plans.
How do I pick between the free and paid plans in this list?
Start with the free plan or trial for any best dashboard reporting tools option that offers one, and use it for at least two weeks on real tasks. Upgrade only when you hit a clear limit, such as a missing feature, a user cap, or a storage limit, rather than paying on day one for features you may never use. Compare the paid tier against the next option in this list as well, since a different tool's free plan may already cover what the first tool charges for.