Best data visualization tools in 2026: 8 Options Compared

- 1
 Tableauenterprise analytics with polished visualsVisit
- 2
 Microsoft Power BIMicrosoft shops wanting low-cost BIVisit
- 3
 Google Looker Studiofree dashboards for Google dataVisit
- 4
 Qlik Senseassociative exploration and embedded analyticsVisit
- 5
 Grafanaoperational and real-time dashboardsVisit
- Tableau leads on visualisation polish, while Power BI leads on price for Microsoft shops.
- Looker Studio is the best free dashboard tool for Google data, and Metabase suits startup self-service BI.
- Grafana suits operational dashboards, while D3.js suits fully custom web visuals.
- Start from your data sources and audience: executives need polished dashboards, engineers need live metrics.
Quick comparison
| Product | Ideal for | Price from | Free version | |
|---|---|---|---|---|
| Tableau | enterprise analytics with polished visuals | $15 per user per month | Free trial | Visit |
| Microsoft Power BI | Microsoft shops wanting low-cost BI | $14 per user per month | Yes | Visit |
| Google Looker Studio | free dashboards for Google data | Free | Yes | Visit |
| Qlik Sense | associative exploration and embedded analytics | See website | Free trial | Visit |
| Grafana | operational and real-time dashboards | Free | Yes | Visit |
 Metabase | startup self-service BI | Free | Yes | Visit |
 D3.js | fully custom web visualisations | Free | Yes | Visit |
 Infogram | quick infographics and reports for non-analysts | $19 per month | Free trial | Visit |
The best data visualization tools
Here is our shortlist for best data visualization tools, ordered from the most broadly useful picks to the more specialised ones. Every entry below is a real product you can sign up for or buy today, with pricing taken from the vendor site or app store listing where we could verify it.
Tableau
Ideal for: enterprise analytics with polished visuals
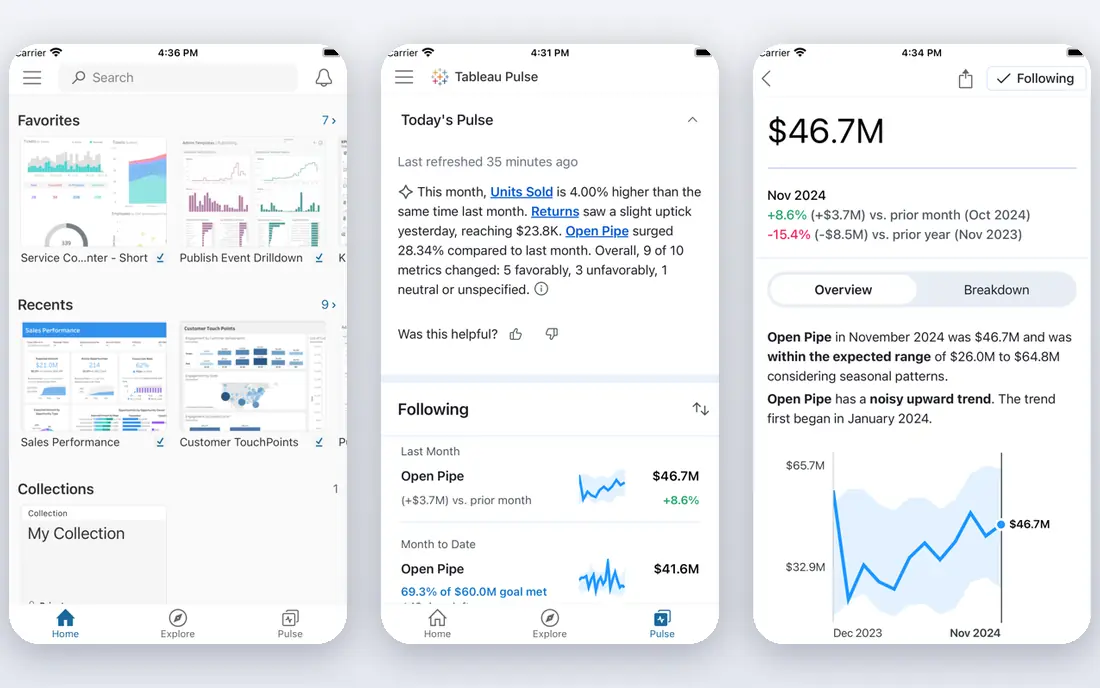
This one is aimed at enterprise analytics with polished visuals. Tableau remains the benchmark for interactive visualisation, with drag-and-drop exploration, strong mapping and guided stories that make data feel alive. Viewer seats start at $15 per user a month, while Creator seats that build content cost $75.
The Creator price is the catch, and the semantic layer sits apart from the visualisation layer. For organisations that prioritise visual quality, it is still the leader.
- Best-in-class interactive visuals
- Drag-and-drop exploration
- Strong mapping and stories
- Creator at $75 per user a month is pricey
- Separate semantic layer adds complexity
Microsoft Power BI
Ideal for: Microsoft shops wanting low-cost BI

Think of Microsoft Power BI as the pick for Microsoft shops wanting low-cost BI. Microsoft Power BI Pro at $14 per user a month gives Microsoft shops a full BI platform with built-in semantic models in DAX and native Excel, Teams and SharePoint integration. Power BI Desktop is free for building reports.
Governed enterprise scale needs Premium capacity, and DAX takes learning. For Microsoft-centric teams, the price and integration are decisive.
- Pro at $14 per user a month
- Built-in DAX semantic models
- Native Excel and Teams integration
- Premium capacity needed for governed scale
- DAX learning curve
Google Looker Studio
Ideal for: free dashboards for Google data

For free dashboards for Google data, Google Looker Studio deserves a close look. Looker Studio is free and the natural dashboard tool for Google Ads, Analytics and Sheets data, with easy sharing by link. Small teams can publish a useful dashboard in an afternoon without a licence.
It is limited for complex enterprise BI, and very large datasets can slow it down. For free, Google-centred reporting, it is the obvious start.
- Free with a Google account
- Strong Google Ads and Analytics connectors
- Easy sharing
- Limited for complex enterprise BI
- Performance lags on very large data
Qlik Sense
Ideal for: associative exploration and embedded analytics
This is the option we would point associative exploration and embedded analytics toward first. Qlik Sense uses an associative engine that lets users explore data freely, seeing how selections affect every chart at once, which suits analysts who explore rather than follow a fixed path. Embedded analytics are a strength for customer-facing dashboards.
Pricing is quote-based for many plans, and advanced use takes learning. For exploration-led teams, the associative model is distinctive.
- Associative engine for free exploration
- Strong embedded analytics
- AI-assisted insights
- Pricing is quote-based for many plans
- Learning curve for advanced use
Grafana
Ideal for: operational and real-time dashboards
Grafana earns its place here for operational and real-time dashboards. Grafana is the standard for operational dashboards, visualising time-series metrics, logs and alerts from servers, apps and IoT devices. The open-source version is free to self-host, with Grafana Cloud for managed hosting.
Business reporting and governed BI features are thinner than Tableau or Power BI, and setup needs engineering time. For live systems monitoring, it is unmatched.
- Free self-hosted option
- Excellent time-series and metrics visuals
- Huge plugin range
- Business reporting features are thinner
- Setup needs engineering time
Metabase
Ideal for: startup self-service BI
If your shortlist is built around startup self-service BI, start with Metabase. Metabase lets non-analysts ask questions of data through a simple builder and get charts without SQL, with a free open-source version that deploys quickly. Startups use it as their first BI tool before graduating to enterprise platforms.
Advanced features and enterprise governance need paid plans, and it is lighter than Tableau or Power BI at scale. For a first self-service BI tool, it is a friendly pick.
- Free open-source version
- Simple question builder for non-analysts
- Quick to deploy
- Advanced features need paid plans
- Enterprise governance is lighter than leaders
D3.js
Ideal for: fully custom web visualisations
Among the options here, D3.js speaks most directly to fully custom web visualisations. D3.js gives developers complete control over web visualisations, from custom charts to interactive maps, with a huge gallery of examples to learn from. Publication-quality, bespoke visuals start here.
It needs expert JavaScript, and every chart is hand-built, so projects take weeks rather than hours. For custom work where no BI tool fits, it is the only choice.
- Complete control over every visual element
- Huge gallery of examples
- Free and open source
- Needs expert JavaScript
- Every chart is hand-built
Infogram
Ideal for: quick infographics and reports for non-analysts
For readers focused on quick infographics and reports for non-analysts, Infogram is a strong match. Infogram builds infographics, reports and simple dashboards fast, with templates that suit marketing, media and communications teams. Pro at $19 a month opens up the fuller feature set.
It lacks enterprise BI depth, and serious analysis belongs elsewhere. For beautiful, shareable reports made by non-analysts, it is quick and effective.
- Fast infographic and report builder
- Templates for marketing and media
- Easy sharing
- Less depth for enterprise BI
- Pro needed for full features
How we picked these
We compared official feature pages, pricing pages, app store listings, privacy policies and public reviews for each product on this list, and we kept only products that exist and work today and that truly fit the topic. Where a price had changed between sources or we could not verify it on the vendor site, we wrote See website rather than print a number we could not stand behind. We also weighed who each product is really for, not just how long its feature list runs. A product with a smaller set of features can be the better buy when it matches your workflow, your budget and the size of your team, and we say so plainly in each write-up. We also checked what each product costs over a full year, not just the headline monthly price, since annual billing, seat minimums and add-on fees can change the real total by a wide margin. Free plans were judged against their limits too: a free tier that caps the exact feature you need most is not really free for your use case, and we say so in the write-up when that is the case. Where prices differed between the vendor site and review listings, we trusted the vendor site, and where we could not confirm a figure on the vendor site at all, we wrote See website rather than repeat a number from a third party. That caution is deliberate, because a wrong price is worse than no price when you are building a budget.
Dashboard tool or chart library: a fork in the road
BI platforms like Tableau, Power BI and Metabase answer business questions with governed data and scheduled dashboards, while libraries like D3.js answer design questions with bespoke visuals. Most teams need a BI platform first, and only reach for a library when a specific visual cannot be built in one.
Test with your real data and your real audience. Load a messy dataset, build the three charts your boss actually asks for, and share the result with a non-analyst. The tool that survives that test without a week of setup is the one to buy.
Finally, before you commit to one of the options above, run it on a real task from your own work rather than a polished demo project. Use the free tier or trial for a full week, invite the people who will actually use it every day, and test the one workflow you cannot live without, whether that is exporting your data, inviting a teammate, sharing a result with a client or getting help when something breaks. Note how long each step takes and where you get stuck, since those friction points are what you will live with for months. The product that handles your real task with the least friction is the right one, even if another option looks stronger on a feature comparison page.
Frequently asked questions
What is the best data visualization tool?
Tableau is best for visualisation polish, Power BI is best for Microsoft shops on price, and Looker Studio is best free for Google data. Metabase suits startup self-service BI.
Is Power BI better than Tableau?
Power BI is far cheaper at $14 per user a month for Pro versus $75 for Tableau Creator, and integrates better with Microsoft tools. Tableau leads on visualisation polish and exploration feel.
What is the best free data visualization tool?
Google Looker Studio is free for dashboards, Metabase open source is free to self-host, and D3.js is free for custom web visuals. Grafana open source is free for operational dashboards.
Do I need to code for data visualization?
No, Tableau, Power BI, Looker Studio, Metabase and Infogram all offer drag-and-drop or question-builder interfaces. Coding is only needed for fully custom visuals with D3.js or similar libraries.