Best Hardware Monitoring Software in 2026: 7 Tools Compared

- 1
 HWMonitorUsers who want a simple free readoutVisit
- 2
 HWiNFOEnthusiasts who want deep sensor dataVisit
- 3
 MSI AfterburnerGamers who want overlays and GPU controlVisit
- 4
 Open Hardware MonitorUsers who want a free open source optionVisit
- 5
 NZXT CAMNZXT owners and users who want a polished dashboardVisit
- Our pick for most people is HWMonitor, which stands out for users who want a simple free readout.
- HWiNFO is the strongest alternative if you want enthusiasts who want deep sensor data, and it is worth comparing side by side with our top pick.
- 6 of the 7 options here offer a free plan, so you can test the core features before paying anything.
- Prices vary widely, and several options use quote based pricing, so check the official pricing page for your team size before you decide.
- The right choice depends on your budget, your must have features, and how much setup time you can spare, so use the buying guide below to narrow the list to two or three finalists.
Quick comparison
| Product | Ideal for | Price from | Free version | |
|---|---|---|---|---|
| HWMonitor | Users who want a simple free readout | Free | Yes | Visit |
| HWiNFO | Enthusiasts who want deep sensor data | Free | Yes | Visit |
| MSI Afterburner | Gamers who want overlays and GPU control | Free | Yes | Visit |
| Open Hardware Monitor | Users who want a free open source option | Free | Yes | Visit |
| NZXT CAM | NZXT owners and users who want a polished dashboard | Free | Yes | Visit |
 Core Temp | Users who only care about CPU temperature | Free | Yes | Visit |
 AIDA64 | Professionals who want stress testing and reports | See website | Free trial | Visit |
The best hardware monitoring software
We compared 7 options for best hardware monitoring software, looking at features, pricing, free plans, and honest weaknesses, so you can choose with confidence. The list below mixes well known leaders with smaller options that punch above their weight, and every product block sets out who it fits best and where it falls short.
HWMonitor
Ideal for: Users who want a simple free readout
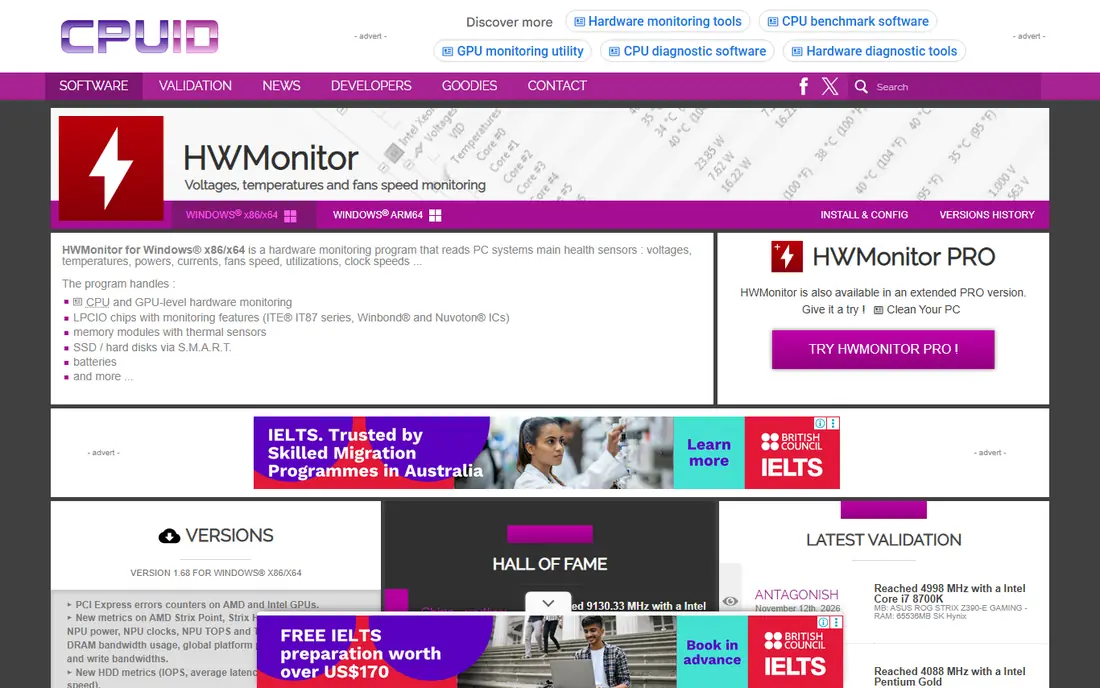
HWMonitor from CPUID shows temperatures, voltages, fan speeds, and clock speeds in a single scrolling list. It is free, light, and easy to read, which makes it a good first tool for anyone wondering whether their PC runs hot. There is little to configure, so you open it and get answers.
The free version lacks an in game overlay and detailed logging, and the interface is purely functional. If you want graphs, alerts, or overlays, look at HWiNFO or MSI Afterburner. For a quick health check, HWMonitor remains hard to beat.
Before you commit to HWMonitor, weigh the trade offs in the pros and cons above against your own priorities, and use the free plan to test it with a real task. Free access makes it easy to check the core experience, but watch for the limits that matter to you, such as the drawbacks noted above, before you build a routine around it.
- Simple clear sensor list
- Free version covers basics
- Low system load
- No overlay or logging in free version
- Interface is plain
HWiNFO
Ideal for: Enthusiasts who want deep sensor data
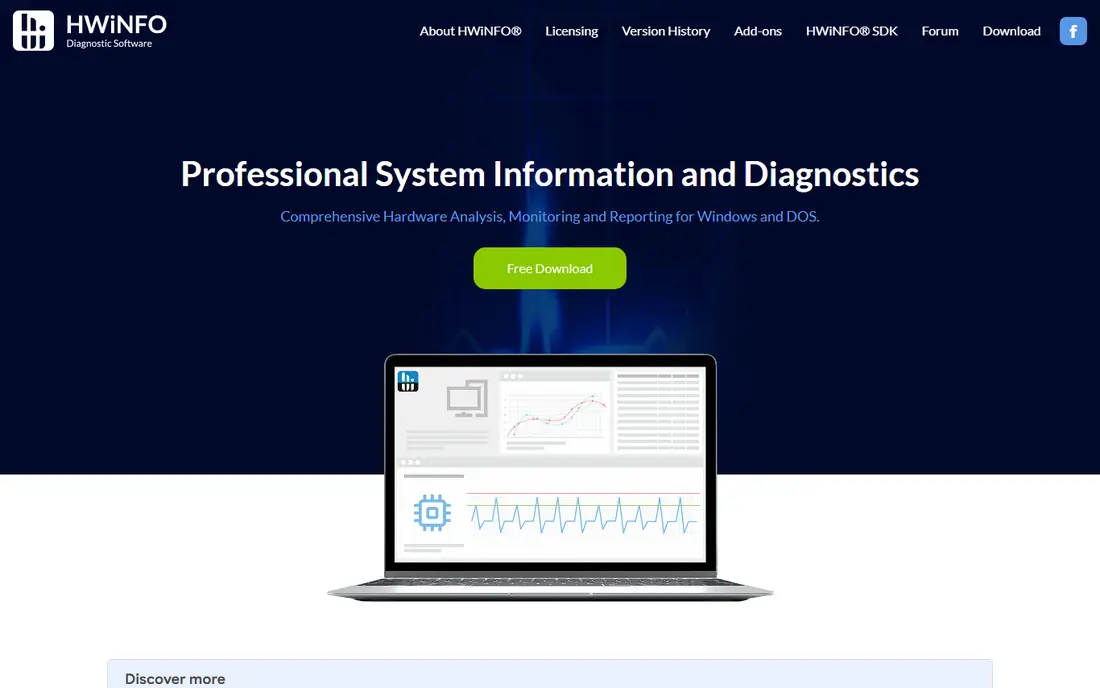
HWiNFO is the most detailed free monitoring tool most users will ever need. It reports hundreds of sensors, supports logging to files, and lets you build custom graphs and alerts. Overclockers and troubleshooters rely on it to catch throttling and voltage problems other tools miss.
That depth makes the first run intimidating, with long sensor lists and many settings. Take time to hide sensors you do not need. Once configured, HWiNFO is the tool serious users keep installed.
Before you commit to HWiNFO, weigh the trade offs in the pros and cons above against your own priorities, and use the free plan to test it with a real task. Free access makes it easy to check the core experience, but watch for the limits that matter to you, such as the drawbacks noted above, before you build a routine around it.
- Very detailed sensor coverage
- Logging and alerts
- Customizable sensors and graphs
- Interface can overwhelm beginners
- Setup takes time
MSI Afterburner
Ideal for: Gamers who want overlays and GPU control
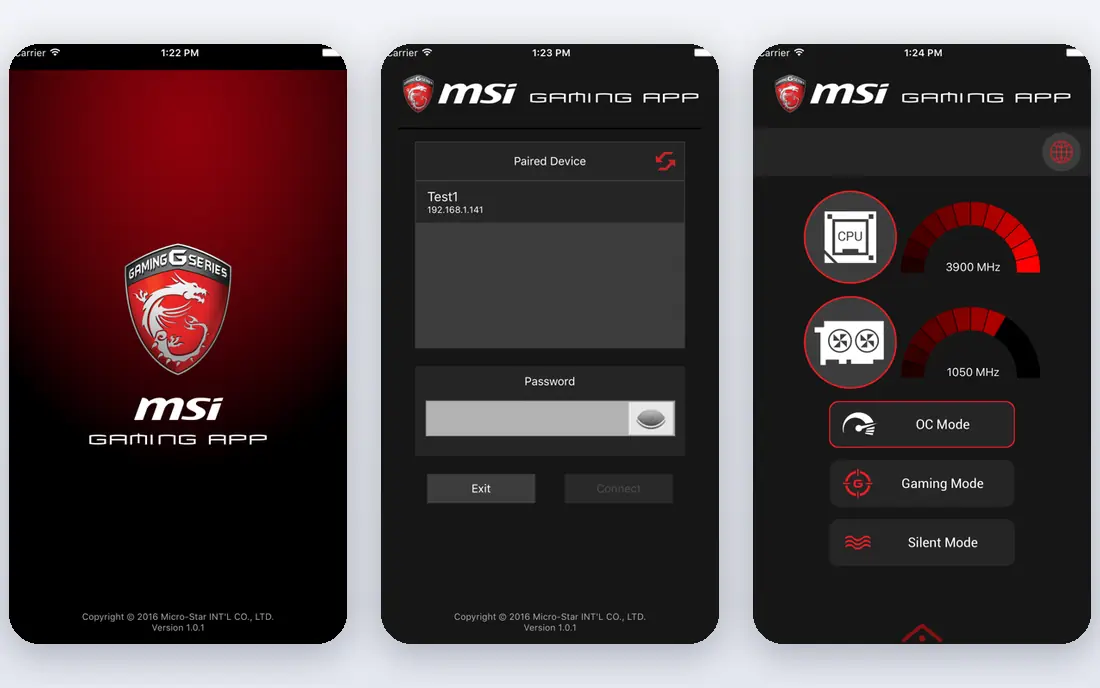
MSI Afterburner is best known for GPU overclocking, but its monitoring overlay is the reason many gamers install it. You can watch GPU temperature, usage, and frame rates while playing, without alt tabbing. It works with graphics cards from most brands, not just MSI.
CPU and system detail is thinner than HWiNFO, so it is not a full system monitor on its own. Pair it with a CPU tool if you need both. For gamers, the overlay alone makes it essential.
Before you commit to MSI Afterburner, weigh the trade offs in the pros and cons above against your own priorities, and use the free plan to test it with a real task. Free access makes it easy to check the core experience, but watch for the limits that matter to you, such as the drawbacks noted above, before you build a routine around it.
- In game overlay
- GPU overclocking and fan control
- Works on most graphics cards
- GPU focused, so CPU detail is limited
- Interface looks dated
Open Hardware Monitor
Ideal for: Users who want a free open source option
Open Hardware Monitor is a free, open source tool that reports temperatures, fan speeds, voltages, and clock speeds. It runs quietly in the background and suits users who prefer open source software or want a no fuss system tray readout.
Development has slowed, so support for very new hardware can lag behind HWiNFO. For older and mid range systems it works well. If you run the latest chips, check that your sensors appear before relying on it.
Before you commit to Open Hardware Monitor, weigh the trade offs in the pros and cons above against your own priorities, and use the free plan to test it with a real task. Free access makes it easy to check the core experience, but watch for the limits that matter to you, such as the drawbacks noted above, before you build a routine around it.
- Open source and free
- Shows temps, fans, and voltages
- Light footprint
- Development is slow
- Newer hardware support can lag
NZXT CAM
Ideal for: NZXT owners and users who want a polished dashboard
NZXT CAM pairs monitoring with control of NZXT cases, coolers, and lighting, all in a polished dashboard. It shows temperatures, loads, and frame rates, and includes an in game overlay. Owners of NZXT hardware get the most from it, since cooling and lighting control sit in the same app.
CAM is heavier than minimal tools, and it encourages an account signup. Users without NZXT hardware may prefer a lighter option. For NZXT builds, though, one app for monitoring and control is convenient.
Before you commit to NZXT CAM, weigh the trade offs in the pros and cons above against your own priorities, and use the free plan to test it with a real task. Free access makes it easy to check the core experience, but watch for the limits that matter to you, such as the drawbacks noted above, before you build a routine around it.
- Polished dashboard
- Game overlay
- Controls NZXT lighting and cooling
- Account signup encouraged
- Heavier than minimal tools
Core Temp
Ideal for: Users who only care about CPU temperature
Core Temp does one job well: it shows per core CPU temperatures, including in the system tray. If your question is simply whether your processor runs too hot, this is the fastest answer. It is free, light, and easy to leave running.
It covers the CPU only, so GPU temperatures, fan speeds, and voltages need a second tool. Take care during install to decline bundled offers. As a focused CPU thermometer, it is excellent.
Before you commit to Core Temp, weigh the trade offs in the pros and cons above against your own priorities, and use the free plan to test it with a real task. Free access makes it easy to check the core experience, but watch for the limits that matter to you, such as the drawbacks noted above, before you build a routine around it.
- Focused CPU temperature readout
- Per core detail
- System tray display
- CPU only, so GPU and fans need another tool
- Installer bundles optional offers to decline
AIDA64
Ideal for: Professionals who want stress testing and reports
AIDA64 goes beyond monitoring into hardware detection, stress testing, and detailed system reports. IT professionals use it to document systems, test stability under load, and diagnose faults with precise sensor data. The trial lets you test the core features.
It is paid software with a dense interface, which is more than casual users need. For technicians and enthusiasts who want testing and reporting in one package, the cost is easier to justify than buying separate tools.
Before you commit to AIDA64, weigh the trade offs in the pros and cons above against your own priorities, and use the free trial to test it with a real task. A trial is the best way to learn whether the strengths outweigh the drawbacks noted above, so run it with your actual workload rather than a sample project.
- Deep hardware detection
- Stress testing
- Detailed reports and benchmarks
- Paid software
- Interface is dense for casual users
How we picked these
We compared official feature pages, pricing pages, app store listings, privacy policies, and public reviews for each option, and we checked that every product website listed here loads and belongs to that product. We did not claim hands-on testing we did not do, and we favored products that are clearly available now, with pricing or free plan details we could verify or honestly mark as quote based.
We also weighed fit for the topic over raw popularity. A famous product that only partly covers the need lost ground to a smaller option built for the job, and we kept an eye on pricing at realistic team or household sizes rather than headline discounts that few buyers actually get.
What to look for in a monitoring tool
Start with your must have features
Write down the three features you cannot do without, then score each finalist against that short list. A long feature list looks impressive, but most buyers use a small set of features daily, and the product that nails those three will serve you better than a broader tool with a weak core. Check the free plan or trial limits against your real workload, not a demo, so you learn about caps before you commit.
Compare total cost, not just the headline price
Look at the price at your actual size, including per user fees, add ons, and payment or transaction charges. A free plan can be the cheapest start, but it can also cost time if it lacks a feature you need every week. Ask what happens when you grow: does the next tier jump sharply, and does the product still fit at that size?
Test before you commit
Run a short trial with a real task from your daily work, not a sample project. Invite the people who will use the product every day, and watch where they get stuck. A tool that feels easy in a sales demo but confusing in daily use will cost you adoption, so trust the trial more than the brochure.
Check support and the exit route
Look at how you get help when something breaks: live chat, email, phone, or community forums, and whether support hours match your working hours. Also check how you export your data if you leave, since a tool that locks your work inside is a long term risk. A clear export path and responsive support are worth more than a small price difference.
Frequently asked questions
What does hardware monitoring software track?
It tracks temperatures, fan speeds, voltages, clock speeds, and load for your CPU, GPU, memory, and drives. Some tools add overlays that show these numbers while you play games. The goal is to spot overheating or throttling before it causes crashes.
Is hardware monitoring software free?
Many of the best tools are free, including HWMonitor, HWiNFO, and Open Hardware Monitor. Paid tools usually add logging, alerting, or business features. For a home PC, a free tool is often all you need.
What temperature is too high for a CPU or GPU?
Safe limits vary by chip, so check your processor and graphics card specifications. As a rough guide, sustained temperatures well above 90 degrees Celsius deserve attention, and throttling or shutdowns mean cooling needs fixing. Monitoring software helps you see the trend, not just a single spike.
Can monitoring software slow down my PC?
Well made tools use very little CPU, though overlays and frequent polling add a small load. If you notice stutter, lower the polling rate or close the overlay. For most users the impact is negligible.
Do I need monitoring software on a laptop?
It helps, since laptops run hot in small cases and often throttle under load. A quick check can show whether heat, rather than the software you run, is behind slowdowns. Just keep expectations realistic: thin laptops will always run warmer than desktops.