Best Infrastructure Monitoring Software in 2026: 8 Options Compared

- 1
 DatadogTeams that want unified infrastructure, logs and tracesVisit
- 2
 New RelicTeams that want full-stack observability plus infrastructureVisit
- 3
 DynatraceEnterprises that want AI-assisted observabilityVisit
- 4
 ZabbixTeams that want free open-source infrastructure monitoringVisit
- 5
 NagiosTeams that want established open-source monitoringVisit
- Datadog is a strong option for teams that want unified infrastructure, logs and traces, with unified monitoring across infrastructure and apps as a key strength.
- New Relic is a strong option for teams that want full-stack observability plus infrastructure, with full-stack monitoring as a key strength.
- Dynatrace is a strong option for enterprises that want ai-assisted observability, with ai-assisted root cause analysis as a key strength.
- Zabbix is a strong option for teams that want free open-source infrastructure monitoring, with free open-source core as a key strength.
- Compare total cost and free limits across at least two options before paying, since headline prices often leave out key features.
Quick comparison
| Product | Ideal for | Price from | Free version | |
|---|---|---|---|---|
| Datadog | Teams that want unified infrastructure, logs and traces | See website | Free trial | Visit |
| New Relic | Teams that want full-stack observability plus infrastructure | See website | Yes | Visit |
| Dynatrace | Enterprises that want AI-assisted observability | See website | Free trial | Visit |
| Zabbix | Teams that want free open-source infrastructure monitoring | Free | Yes | Visit |
| Nagios | Teams that want established open-source monitoring | Free | Yes | Visit |
 SolarWinds Observability | Teams that want network plus infrastructure monitoring | See website | Free trial | Visit |
 Grafana | Teams that want flexible dashboards over many data sources | See website | Yes | Visit |
 Prometheus | Teams that want open-source metrics for containers and servers | Free | Yes | Visit |
The best infrastructure monitoring software
These eight tools cover servers, networks, containers and cloud infrastructure monitoring. We compared official feature pages, pricing pages, data sources described by each vendor and public reviews, with attention to alert quality, dashboards, integrations and cost at scale.
Datadog
Ideal for: Teams that want unified infrastructure, logs and traces
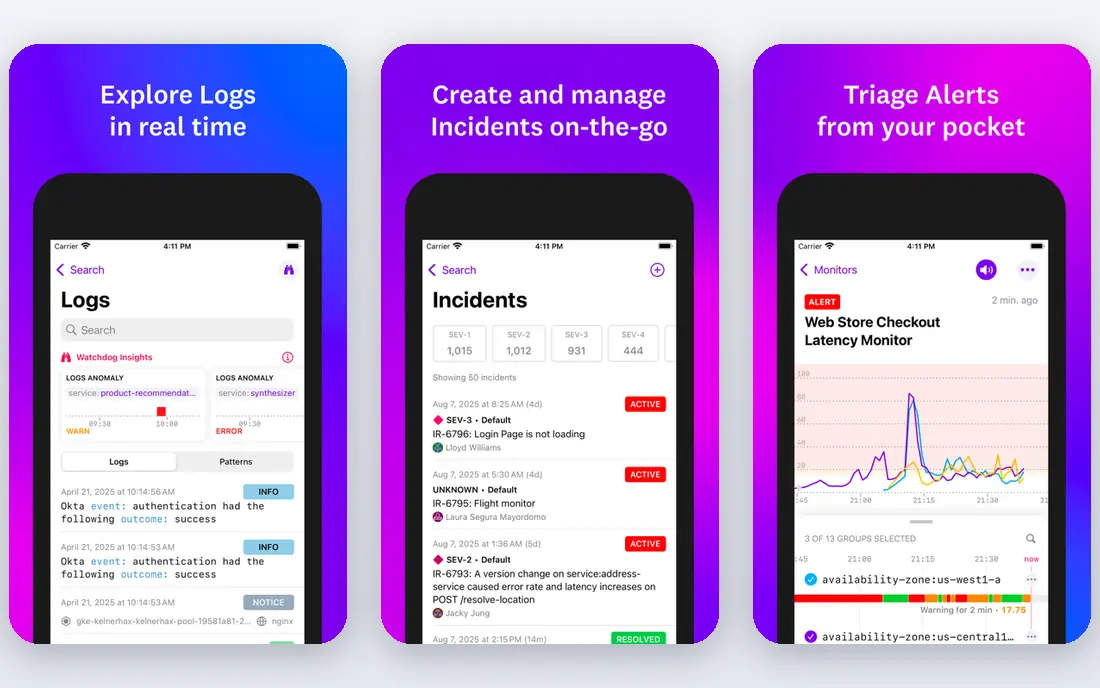
For readers who want a clear starting point, Datadog is worth a close look. It is a strong fit for teams that want unified infrastructure, logs and traces, and its unified monitoring across infrastructure and apps helps explain why it appears on this list. Readers who value that strength will find it easy to justify, even if other options on this list offer more depth in a different area.
On the feature side, unified monitoring across infrastructure and apps; many integrations; strong dashboards give it a clear profile, while the trade-offs are costs can rise fast with data volume; pricing needs careful planning. That balance matters most when you compare it with the next option on this list, since a strength in one area often comes with a limit in another. We found that readers who check those trade-offs first tend to be happier with their choice later.
Before you commit, check the official pricing page for current plans, free limits and any add-on costs, and compare the total cost with one or two other options here. For many readers, Datadog will be the right pick when teams that want unified infrastructure, logs and traces matters more than having every feature on the market.
- Unified monitoring across infrastructure and apps
- Many integrations
- Strong dashboards
- Costs can rise fast with data volume
- Pricing needs careful planning
New Relic
Ideal for: Teams that want full-stack observability plus infrastructure
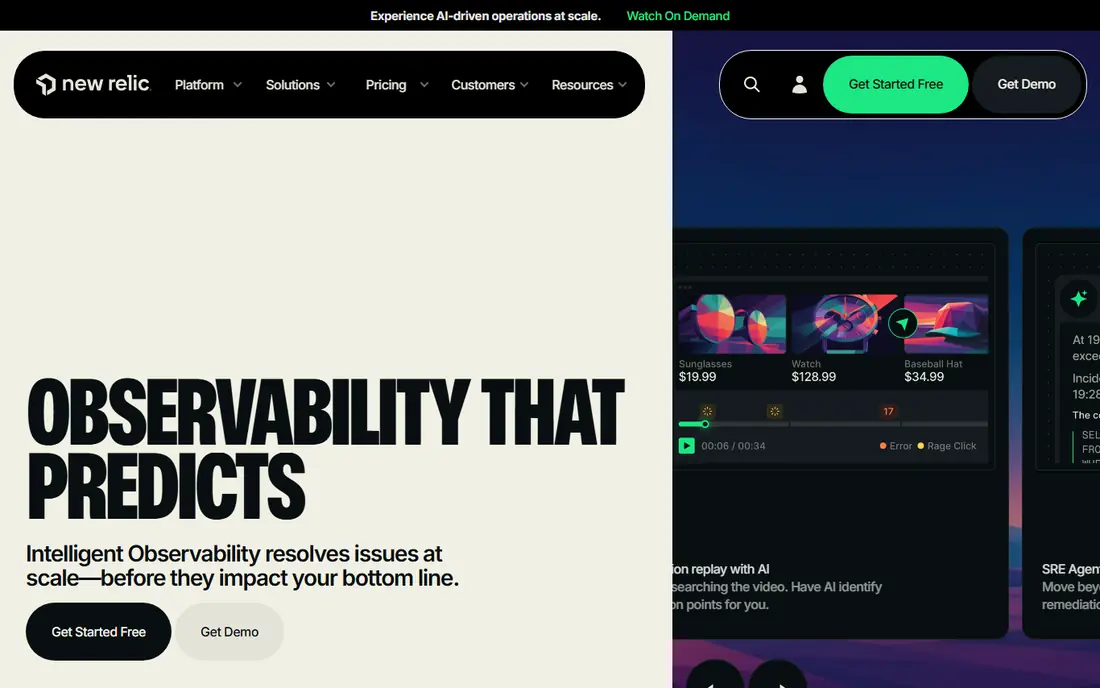
We put New Relic near the top of this list for a simple reason. It is a strong fit for teams that want full-stack observability plus infrastructure, and its full-stack monitoring helps explain why it appears on this list. Readers who value that strength will find it easy to justify, even if other options on this list offer more depth in a different area.
On the feature side, full-stack monitoring; free tier; dashboards and alerts give it a clear profile, while the trade-offs are pricing model needs care at scale; learning curve for new users. That balance matters most when you compare it with the next option on this list, since a strength in one area often comes with a limit in another. We found that readers who check those trade-offs first tend to be happier with their choice later.
Before you commit, check the official pricing page for current plans, free limits and any add-on costs, and compare the total cost with one or two other options here. For many readers, New Relic will be the right pick when teams that want full-stack observability plus infrastructure matters more than having every feature on the market.
- Full-stack monitoring
- Free tier
- Dashboards and alerts
- Pricing model needs care at scale
- Learning curve for new users
Dynatrace
Ideal for: Enterprises that want AI-assisted observability

If enterprises that want AI-assisted observability is your main need, Dynatrace deserves attention. It is a strong fit for enterprises that want AI-assisted observability, and its ai-assisted root cause analysis helps explain why it appears on this list. Readers who value that strength will find it easy to justify, even if other options on this list offer more depth in a different area.
On the feature side, ai-assisted root cause analysis; full-stack coverage; automation give it a clear profile, while the trade-offs are pricing suits larger teams; setup takes time. That balance matters most when you compare it with the next option on this list, since a strength in one area often comes with a limit in another. We found that readers who check those trade-offs first tend to be happier with their choice later.
Before you commit, check the official pricing page for current plans, free limits and any add-on costs, and compare the total cost with one or two other options here. For many readers, Dynatrace will be the right pick when enterprises that want AI-assisted observability matters more than having every feature on the market.
- AI-assisted root cause analysis
- Full-stack coverage
- Automation
- Pricing suits larger teams
- Setup takes time
Zabbix
Ideal for: Teams that want free open-source infrastructure monitoring
Zabbix earns its place here through a practical mix of features and value. It is a strong fit for teams that want free open-source infrastructure monitoring, and its free open-source core helps explain why it appears on this list. Readers who value that strength will find it easy to justify, even if other options on this list offer more depth in a different area.
On the feature side, free open-source core; flexible monitoring; templates give it a clear profile, while the trade-offs are setup and maintenance need technical skill; interface is functional. That balance matters most when you compare it with the next option on this list, since a strength in one area often comes with a limit in another. We found that readers who check those trade-offs first tend to be happier with their choice later.
Before you commit, check the official pricing page for current plans, free limits and any add-on costs, and compare the total cost with one or two other options here. For many readers, Zabbix will be the right pick when teams that want free open-source infrastructure monitoring matters more than having every feature on the market.
- Free open-source core
- Flexible monitoring
- Templates
- Setup and maintenance need technical skill
- Interface is functional
Nagios
Ideal for: Teams that want established open-source monitoring
Start with Nagios if you want a widely used option with plenty of support material. It is a strong fit for teams that want established open-source monitoring, and its long-established monitoring helps explain why it appears on this list. Readers who value that strength will find it easy to justify, even if other options on this list offer more depth in a different area.
On the feature side, long-established monitoring; plugins; alerting give it a clear profile, while the trade-offs are setup and modern dashboards need extra work; interface is dated. That balance matters most when you compare it with the next option on this list, since a strength in one area often comes with a limit in another. We found that readers who check those trade-offs first tend to be happier with their choice later.
Before you commit, check the official pricing page for current plans, free limits and any add-on costs, and compare the total cost with one or two other options here. For many readers, Nagios will be the right pick when teams that want established open-source monitoring matters more than having every feature on the market.
- Long-established monitoring
- Plugins
- Alerting
- Setup and modern dashboards need extra work
- Interface is dated
SolarWinds Observability
Ideal for: Teams that want network plus infrastructure monitoring
For a different angle on this category, consider SolarWinds Observability. It is a strong fit for teams that want network plus infrastructure monitoring, and its network and infrastructure views helps explain why it appears on this list. Readers who value that strength will find it easy to justify, even if other options on this list offer more depth in a different area.
On the feature side, network and infrastructure views; alerting; reporting give it a clear profile, while the trade-offs are pricing and product packaging have changed, so check current plans. That balance matters most when you compare it with the next option on this list, since a strength in one area often comes with a limit in another. We found that readers who check those trade-offs first tend to be happier with their choice later.
Before you commit, check the official pricing page for current plans, free limits and any add-on costs, and compare the total cost with one or two other options here. For many readers, SolarWinds Observability will be the right pick when teams that want network plus infrastructure monitoring matters more than having every feature on the market.
- Network and infrastructure views
- Alerting
- Reporting
- Pricing and product packaging have changed, so check current plans
Grafana
Ideal for: Teams that want flexible dashboards over many data sources
Grafana is the kind of option that suits buyers who know what they want. It is a strong fit for teams that want flexible dashboards over many data sources, and its flexible dashboards helps explain why it appears on this list. Readers who value that strength will find it easy to justify, even if other options on this list offer more depth in a different area.
On the feature side, flexible dashboards; many data sources; open-source core give it a clear profile, while the trade-offs are needs separate data collection tools; setup takes engineering time. That balance matters most when you compare it with the next option on this list, since a strength in one area often comes with a limit in another. We found that readers who check those trade-offs first tend to be happier with their choice later.
Before you commit, check the official pricing page for current plans, free limits and any add-on costs, and compare the total cost with one or two other options here. For many readers, Grafana will be the right pick when teams that want flexible dashboards over many data sources matters more than having every feature on the market.
- Flexible dashboards
- Many data sources
- Open-source core
- Needs separate data collection tools
- Setup takes engineering time
Prometheus
Ideal for: Teams that want open-source metrics for containers and servers
We kept Prometheus on this list because it covers the basics well and adds useful extras. It is a strong fit for teams that want open-source metrics for containers and servers, and its free open-source metrics helps explain why it appears on this list. Readers who value that strength will find it easy to justify, even if other options on this list offer more depth in a different area.
On the feature side, free open-source metrics; strong for kubernetes; alerting with alertmanager give it a clear profile, while the trade-offs are needs setup and dashboard tools; long-term storage needs planning. That balance matters most when you compare it with the next option on this list, since a strength in one area often comes with a limit in another. We found that readers who check those trade-offs first tend to be happier with their choice later.
Before you commit, check the official pricing page for current plans, free limits and any add-on costs, and compare the total cost with one or two other options here. For many readers, Prometheus will be the right pick when teams that want open-source metrics for containers and servers matters more than having every feature on the market.
- Free open-source metrics
- Strong for Kubernetes
- Alerting with Alertmanager
- Needs setup and dashboard tools
- Long-term storage needs planning
How we picked these
We compared official feature pages, pricing pages, app store listings where relevant, privacy policies and public reviews for each option, and we kept only products that exist and work in October 2026 and truly fit the topic. We favored a mix of widely used leaders and strong smaller options, and we noted honest weaknesses alongside strengths so readers can judge trade-offs for themselves.
We did not claim hands-on testing that did not happen. We used See website where a current price could not be verified, rather than guessing.
How to choose the right option for your needs
Start by listing the systems you must watch, such as servers, networks, containers and cloud services, then check data ingestion, alert routing and dashboard needs for each one. Test alert noise during a busy week, since a tool that pages your team for minor issues will be ignored when a real outage hits. Compare data costs honestly, since usage-based pricing can surprise teams that monitor everything at high detail.
Frequently asked questions
What are the best monitoring tools for infrastructure?
Datadog, New Relic and Dynatrace suit teams that want hosted observability, while Zabbix, Nagios, Grafana and Prometheus suit teams that want open-source control.
What is the best infrastructure monitoring tool?
For hosted ease, Datadog and New Relic are strong starting points. For open-source flexibility, Grafana plus Prometheus is a common pairing, while Zabbix suits traditional server and network monitoring.
Is there free infrastructure monitoring software?
Zabbix, Nagios and Prometheus are free open-source options, and Grafana, New Relic and Datadog offer free tiers or trials. Free tiers usually cap data, users or retention.
How do I avoid alert fatigue?
Tune thresholds, route alerts by severity and service, and review noisy alerts weekly. Good monitoring tools help by grouping related alerts and suppressing duplicates.
Do I need observability or just monitoring?
Monitoring tracks known metrics and alerts. Observability adds logs and traces to explain why a problem happened. Larger and cloud-native teams benefit most from full observability.