Best Kubernetes Observability Tools in 2026: 8 Options Compared

- 1
 DatadogTeams that want full Kubernetes observability in one platformVisit
- 2
 New RelicTeams that want application and Kubernetes insight togetherVisit
- 3
 GrafanaTeams that want flexible dashboards and open source toolsVisit
- 4
 PrometheusTeams that want open source Kubernetes metricsVisit
- 5
 DynatraceEnterprises that want AI-assisted observabilityVisit
- Our pick for most people is Datadog, thanks to its balance of features, ease of use and value for teams that want full kubernetes observability in one platform.
- New Relic is the strongest alternative when teams that want application and kubernetes insight together matters more than a general all-round fit.
- Free and trial options exist, including Grafana, so you can test the core experience before paying.
- We compared metrics, logs and traces coverage, Kubernetes integration, alerting, dashboards, pricing and ease of setup.
- Check pricing, free plan terms and the exact features you need on the official site before you subscribe, since plans change.
Quick comparison
| Product | Ideal for | Price from | Free version | |
|---|---|---|---|---|
| Datadog | Teams that want full Kubernetes observability in one platform | See website | Free trial | Visit |
| New Relic | Teams that want application and Kubernetes insight together | See website | Yes | Visit |
| Grafana | Teams that want flexible dashboards and open source tools | See website | Yes | Visit |
| Prometheus | Teams that want open source Kubernetes metrics | See website | Yes | Visit |
| Dynatrace | Enterprises that want AI-assisted observability | See website | Free trial | Visit |
 Splunk | Enterprises that want observability plus log analytics | See website | Free trial | Visit |
 Honeycomb | Teams that want trace-led debugging for complex services | See website | Yes | Visit |
 Elastic Observability | Teams that want search-based observability on Elastic | See website | Free trial | Visit |
The best kubernetes observability tools
Kubernetes observability means seeing metrics, logs and traces across clusters, pods and services, so teams can find problems before users do. The tools below cover full platforms, open source stacks and specialist tracing, with different trade-offs for cost and control.
Datadog
Ideal for: Teams that want full Kubernetes observability in one platform
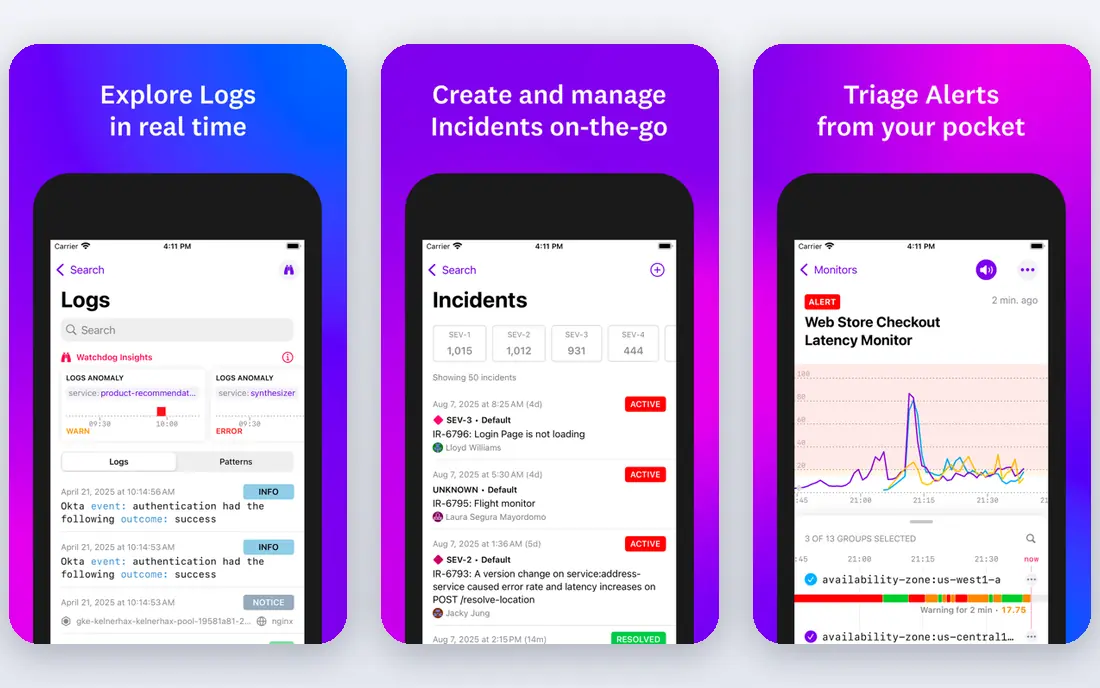
Datadog provides full observability for Kubernetes, with metrics, logs, traces, dashboards and alerting in one platform. It suits teams that want a single pane of glass for clusters, services and infrastructure. Its Kubernetes integration and out-of-the-box dashboards help teams get value quickly.
The trade-offs are usage-based pricing, which can rise fast, and setup care to avoid noisy data. For a team that wants comprehensive observability without assembling open source tools, Datadog is a leading choice.
For readers who want teams that want full kubernetes observability in one platform, Datadog is a sensible shortlist pick, provided the limits above feel acceptable. Compare its pricing page and trial terms before you commit, and check that it covers the exact workflow you need on day one.
- Metrics, logs and traces
- Kubernetes dashboards
- Alerting
- Pricing can rise with usage
- Setup needs care
New Relic
Ideal for: Teams that want application and Kubernetes insight together

New Relic combines application monitoring with Kubernetes observability, giving teams insight into services, clusters and user experience together. It suits teams that want to connect Kubernetes health to application performance and business outcomes. Its dashboards and alerting cover the main observability needs well.
The limits are pricing model care and a broad interface that takes time to learn. For a team that wants application and infrastructure insight in one platform, New Relic is a strong competitor to Datadog.
For readers who want teams that want application and kubernetes insight together, New Relic is a sensible shortlist pick, provided the limits above feel acceptable. Compare its pricing page and trial terms before you commit, and check that it covers the exact workflow you need on day one.
- Application monitoring
- Kubernetes observability
- Dashboards
- Pricing model needs care
- Interface can feel broad
Grafana
Ideal for: Teams that want flexible dashboards and open source tools

Grafana is best known for flexible dashboards and visualisation, often paired with Prometheus for metrics and Loki for logs. It suits teams that want open source control and custom dashboards for Kubernetes. Its community plugins and alerting make it a powerful visualisation layer.
The trade-off is assembly, since Grafana alone does not provide full logs and traces, and setup takes effort. For a team comfortable with open source, the Grafana stack gives control and cost advantages over a single vendor platform.
For readers who want teams that want flexible dashboards and open source tools, Grafana is a sensible shortlist pick, provided the limits above feel acceptable. Compare its pricing page and trial terms before you commit, and check that it covers the exact workflow you need on day one.
- Dashboards and visualisation
- Prometheus and Loki integration
- Alerting
- Needs other tools for full logs and traces
- Setup takes effort
Prometheus
Ideal for: Teams that want open source Kubernetes metrics
Prometheus is the open source standard for Kubernetes metrics, with native service discovery and alerting through Alertmanager. It suits teams that want a proven, community-supported metrics system without vendor lock-in. Its query language, PromQL, is powerful for investigating cluster health.
The limits are scope, since Prometheus covers metrics only and needs Grafana for dashboards and other tools for logs and traces. For metrics, though, it is the foundation of most Kubernetes observability stacks, whether open source or commercial.
For readers who want teams that want open source kubernetes metrics, Prometheus is a sensible shortlist pick, provided the limits above feel acceptable. Compare its pricing page and trial terms before you commit, and check that it covers the exact workflow you need on day one.
- Open source metrics
- Kubernetes native
- Alerting with Alertmanager
- Metrics only
- Needs Grafana for dashboards and other tools for logs
Dynatrace
Ideal for: Enterprises that want AI-assisted observability
Dynatrace provides full-stack observability with AI-assisted root cause analysis, which suits enterprises that want to find problems faster across complex Kubernetes estates. Its automatic topology mapping shows how services, pods and infrastructure connect. For a large, complex system, that automation saves investigation time.
The trade-offs are enterprise pricing and setup care for large estates. Smaller teams may find it heavier than they need, but for an enterprise with complex Kubernetes deployments, Dynatrace is a powerful platform.
For readers who want enterprises that want ai-assisted observability, Dynatrace is a sensible shortlist pick, provided the limits above feel acceptable. Compare its pricing page and trial terms before you commit, and check that it covers the exact workflow you need on day one.
- Full-stack observability
- AI root cause analysis
- Kubernetes support
- Enterprise pricing
- Setup for large estates takes care
Splunk
Ideal for: Enterprises that want observability plus log analytics
Splunk combines log analytics with observability, which suits enterprises that already use Splunk for security or IT operations. Its search language is powerful for investigating logs across Kubernetes and other systems. For a team with large log volumes, Splunk gives deep investigative power.
The limits are pricing at scale and complexity for new users, since Splunk needs expertise to use well. For an enterprise already invested in Splunk, adding observability is natural, but a new team may prefer a simpler platform.
For readers who want enterprises that want observability plus log analytics, Splunk is a sensible shortlist pick, provided the limits above feel acceptable. Compare its pricing page and trial terms before you commit, and check that it covers the exact workflow you need on day one.
- Log analytics
- Observability
- Security integration
- Pricing can be high at scale
- Complexity for new users
Honeycomb
Ideal for: Teams that want trace-led debugging for complex services
Honeycomb focuses on distributed tracing and high-cardinality queries, which suit teams debugging complex, microservice-based Kubernetes systems. Its query tools let engineers slice traces by any attribute, which helps find rare failures that averages hide. For debugging, that depth is distinctive.
The trade-offs are usage-based pricing and lighter metrics dashboards than Datadog. For a team whose main problem is understanding complex service interactions, Honeycomb is an excellent specialist tool, possibly alongside a metrics platform.
For readers who want teams that want trace-led debugging for complex services, Honeycomb is a sensible shortlist pick, provided the limits above feel acceptable. Compare its pricing page and trial terms before you commit, and check that it covers the exact workflow you need on day one.
- Distributed tracing
- High-cardinality queries
- Debugging focus
- Pricing is usage based
- Metrics dashboards are lighter than Datadog
Elastic Observability
Ideal for: Teams that want search-based observability on Elastic
Elastic Observability builds on Elasticsearch, giving teams logs, metrics and traces with Kibana dashboards and alerting. It suits teams already using Elastic for search or security, since observability then shares the same platform. Its search power helps investigate logs at scale.
The limits are resource needs at scale and setup expertise, since running Elastic well takes care. For a team already invested in Elastic, its observability tools are a natural and powerful addition.
For readers who want teams that want search-based observability on elastic, Elastic Observability is a sensible shortlist pick, provided the limits above feel acceptable. Compare its pricing page and trial terms before you commit, and check that it covers the exact workflow you need on day one.
- Logs, metrics and traces on Elasticsearch
- Kibana dashboards
- Alerting
- Resource needs at scale
- Setup takes expertise
How we picked these
We compared official feature pages, pricing pages, app store listings, privacy policies and public reviews for each option, and we focused on products that exist and work in October 2026 and truly fit the topic. We looked for a mix of well-known leaders and strong smaller options, rather than a list of near-identical tools. We compared metrics, logs and traces coverage, Kubernetes integration, alerting, dashboards, pricing and ease of setup. We did not claim hands-on testing that did not happen, and where a price or free tier could not be verified from the vendor site, we wrote See website rather than guessing a number.
Choosing the right option for you
Start with the three signals that matter most, metrics, logs and traces, and check that your tool covers all three for the services you run. A metrics-only tool will leave you guessing when a failure spans several services.
Set up alerts on user-facing symptoms, such as error rates and latency, rather than on every internal metric. Too many alerts cause fatigue, and fatigued teams miss the important ones.
Test the tool during a real incident drill, including tracing a request across services and finding the failing pod. That drill will reveal gaps in data, dashboards and access far better than a demo.
Before you decide, make a short list of three must-have features and one deal-breaker, then test only the two or three options that meet that list. A focused trial will tell you more than a week of comparing feature tables, and it keeps the decision tied to your real work rather than to marketing claims.
Frequently asked questions
What are the best best kubernetes observability tools?
The best choice depends on your needs, but Datadog suits most people, while New Relic is stronger for teams that want application and kubernetes insight together. Start with your must-have features, then trial the top two options before paying.
Is there a free option for best kubernetes observability tools?
Yes, several options here offer a free plan or a free trial, including Grafana. Free plans usually limit advanced features, so check which tools you actually need before judging a free tier.
How much do best kubernetes observability tools cost?
Costs vary widely, and many vendors use quote-based pricing, so the pricing page is the reliable source. Where we could not verify a current price, we wrote See website rather than guessing, and you should get a written quote for team plans.
Which option is best for beginners?
Datadog is the easiest starting point for most beginners, thanks to its clear setup and guidance. If you want the simplest possible tool, look at the free or trial options first and choose the one whose interface feels clearest to you.
How should I choose between these options?
List your top three needs, check integrations and pricing for those needs, and run a short trial with real work. The option that handles your daily tasks smoothly, with support you can reach, is usually the right pick, even if a rival has a longer feature list.