Best Portfolio Management Software in 2026: 8 Tools Compared

- 1
 SharesightDividends and tax reportsVisit
- 2
 KuberaWhole net worth trackingVisit
- 3
 Stock RoverScreening and analysisVisit
- 4
 Morningstar InvestorResearch and Portfolio X-RayVisit
- 5
 Quicken PremierBudgeting plus investingVisit
- Sharesight is our pick for dividend and tax reporting, with automatic corporate actions and tax reports that save hours at year end.
- Kubera suits households with property, crypto and private holdings, while Stock Rover suits investors who build their own screens and models.
- Quicken Premier and Monarch Money cover budgeting plus investing in one place, which suits households that want a single money app.
- Free tools are strong for tracking, but tax reports, brokerage links and deep analysis usually sit on paid tiers, so check what your plan includes.
Quick comparison
| Product | Ideal for | Price from | Free version | |
|---|---|---|---|---|
| Sharesight | Dividends and tax reports | $7 per month | Yes | Visit |
| Kubera | Whole net worth tracking | $250 per year | No | Visit |
| Stock Rover | Screening and analysis | $348 per year | Yes | Visit |
| Morningstar Investor | Research and Portfolio X-Ray | $249 per year | No | Visit |
| Quicken Premier | Budgeting plus investing | See website | No | Visit |
 Monarch Money | All-in-one household money | $99.99 per year | No | Visit |
 Simply Wall St | Visual portfolio summaries | See website | Yes | Visit |
 Snowball Analytics | Dividends and rebalancing | $79.99 per year | Yes | Visit |
The best portfolio management software
Portfolio software has two jobs: showing what you own right now, and helping you judge what to do next. Trackers excel at the first job, research platforms at the second, and household apps try to do both plus budgeting. We compared official pricing pages, brokerage links, tax features and asset coverage.
Sharesight
Ideal for: Dividends and tax reports

Sharesight is built for investors who care about income and tax records. It tracks dividends, reinvestment, splits and other corporate actions automatically, and paid plans produce tax reports that match how many countries treat investment income. Published summaries list the Starter plan at about 7 dollars per month on annual billing, with a free tier for a small number of holdings.
The limit is research depth. Sharesight tells you what your portfolio did and what tax events it created, but it will not screen thousands of stocks or score companies for you. Pair it with a research tool if stock selection is your main job, and use Sharesight as the record book.
- Automatic splits, dividends and corporate actions
- Tax reports on paid plans
- Broad broker and market support
- Paid plans are needed for full tax reporting
- Analysis is lighter than Stock Rover or Morningstar
Kubera
Ideal for: Whole net worth tracking

Kubera suits investors whose wealth is not just a brokerage account. It pulls together stocks, crypto wallets, bank accounts, property, vehicles and private holdings onto one dashboard, with support for many currencies and institutions. Published pricing lists Essentials at 250 dollars per year, with a higher Black tier for families and advisers.
The honest weakness is price for simple portfolios. If you hold a few ETFs at one broker, Kubera is more than you need, and a free tracker will do. Kubera earns its fee when your holdings span asset types and countries, and when a single net worth view saves you from juggling spreadsheets.
- Tracks stocks, crypto, property and private assets in one balance sheet
- Many global bank links
- Estate planning tools
- No free plan
- Pricey if you only hold stocks
- No buy or sell guidance
Stock Rover
Ideal for: Screening and analysis
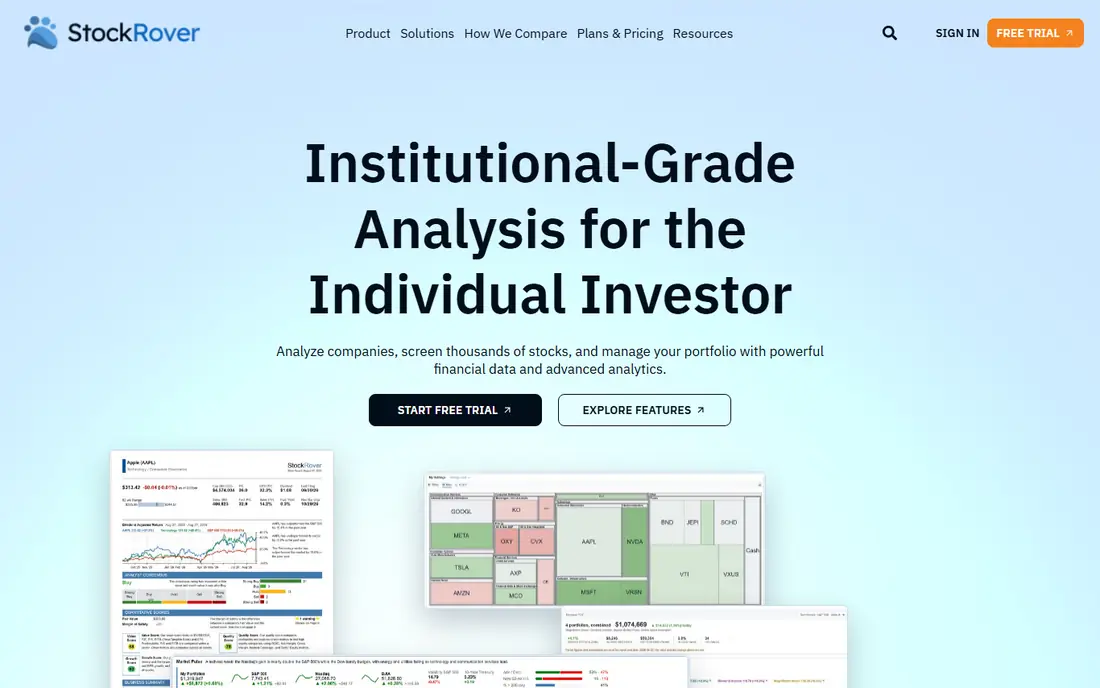
Stock Rover is the analyst tool in this list. It offers screening across hundreds of metrics, portfolio rebalancing, correlation views and alerts on price, fundamentals and earnings. Published summaries list Premium at 348 dollars per year, with higher tiers adding more metrics and history, plus a free tier for basic research and a trial on paid plans.
The catch is complexity. New investors may find the interface dense, and the free tier is limited to basic research rather than full portfolio management. Stock Rover suits investors who already know what they want to screen for and who will use the depth every week.
- Deep screening with hundreds of metrics
- Brokerage linking
- Rebalancing and correlation tools
- Premium pricing is high
- Learning curve is steep for new investors
Morningstar Investor
Ideal for: Research and Portfolio X-Ray
Morningstar Investor pairs research with portfolio analysis. Its Portfolio X-Ray tool breaks a portfolio into asset mix, sector exposure, stock overlap across funds and underlying fees, which is hard to see from a broker statement alone. Published summaries list the plan at about 249 dollars per year, with a trial period for new users.
The limit is day-to-day tracking. Morningstar is better at judging a portfolio than at recording every dividend and tax event, so many investors use it beside Sharesight or their broker. Buy it for research depth, not as a pure record book.
- Independent fund and stock research
- Portfolio X-Ray shows overlap and fees
- Strong analyst coverage
- No free plan for full access
- Tracking features are thinner than dedicated trackers
Quicken Premier
Ideal for: Budgeting plus investing
Quicken Premier suits households that want one app for spending and investing. It tracks budgets, bills, accounts and investments together, so you can see how a portfolio fits beside cash flow and retirement goals. Pricing is published on the vendor site and varies by tier, so check the current Premier price before you commit.
The drawback is effort. Linking many accounts and cleaning up categories takes a weekend of work, and the desktop feel is heavier than a modern web tracker. If you only need investment tracking, a lighter tool will feel faster, but for a full household view Quicken remains a strong choice.
- Combines budgeting, bills and investment tracking
- Desktop depth
- Long history with US households
- Pricing varies by tier and is subscription based
- Setup takes time for many accounts
Monarch Money
Ideal for: All-in-one household money
Monarch Money is the modern household app in this list. It aggregates bank, credit and investment accounts into a clear dashboard, adds budgeting and goal tracking, and lets partners share one view of the household. Published summaries list the plan at about 99.99 dollars per year, with a trial for new users.
The limit is analysis depth. Monarch shows performance and allocation well, but it will not screen stocks or produce tax reports at the level of Sharesight. Choose Monarch when the household money picture matters most, and add a tracker or research tool if investing is your main hobby.
- Clean dashboard for accounts, budgets and investments
- Goal tracking
- Collaborative household access
- No permanent free plan
- Investment analysis is lighter than Stock Rover
Simply Wall St
Ideal for: Visual portfolio summaries
Simply Wall St turns a portfolio into pictures: snowflake scores, dividend views and simple summaries that are easy to read at a glance. A free tier covers basic tracking, and paid plans add deeper analysis and alerts, with pricing on the vendor site. That visual style suits investors who glaze over at dense tables.
The weakness is breadth. Simply Wall St is stock focused, so property, crypto and private holdings need another tool such as Kubera. Use it as your stock dashboard and keep a separate record for everything else.
- Clear visual summaries of holdings
- Dividend analysis
- Weekly portfolio updates
- Paid plans needed for full detail
- Coverage is strongest for stocks rather than all asset types
Snowball Analytics
Ideal for: Dividends and rebalancing
Snowball Analytics focuses on income investors. It tracks dividends, shows an events calendar for earnings, splits and payouts, and links to a large number of brokers for automatic updates. Published summaries list the Starter plan at about 79.99 dollars per year, with a free tier for basic tracking and higher tiers for more portfolios and analysis.
The catch is scale. Snowball is a strong specialist, but its research and asset coverage are narrower than Morningstar or Kubera. Income investors who live by their dividend calendar will like it most, while broad researchers should look elsewhere.
- Dividend calendar and income tracking
- Links to many brokers
- Rebalancing views
- Smaller team and community than larger rivals
- Some features need higher tiers
How we picked these
We compared official pricing pages, broker linking, tax and dividend features, asset coverage and public reviews for tools that are still operating in October 2026. We kept a mix of pure trackers, research platforms and household apps, since readers arrive with different jobs. We did not manage money with these tools ourselves, and we did not repeat any vendor claim about returns or performance.
What to check before you buy
This is not financial advice, and no tracker can pick winning investments for you. Start by listing what you own: brokers, account types, property, crypto and private holdings. A tracker that cannot link your main broker will become a manual chore, so confirm your broker is supported before paying. Also confirm which countries and tax rules the tax reports cover, since a report built for one country may not fit yours.
Next, separate tracking from advice. A good tracker shows performance, allocation and income clearly, but it does not tell you what to buy. Be wary of any tool that mixes tracking with hot stock tips or promises of returns. Keep your investing decisions in a separate process, and use the tracker to record and review them honestly.
Finally, test the free tier or trial with real accounts for two weeks. Check that dividends, splits and corporate actions appear correctly, that the mobile app shows what you need, and that exports work for your tax preparer. A tool that needs constant manual fixes will not survive a busy year, no matter how good its charts look on day one.
Frequently asked questions
What is the best portfolio management software for most investors?
Sharesight is our pick for most investors because dividend tracking, corporate actions and tax reports cover the jobs that cause the most year-end pain. Stock Rover suits active researchers, Kubera suits complex households, and Monarch Money suits couples who want one household dashboard.
Is there a good free portfolio tracker?
Yes. Sharesight, Stock Rover, Simply Wall St and Snowball Analytics all offer free tiers, though each limits holdings, portfolios or reports. Free tiers are enough to test broker linking and basic tracking, but tax reports and deep analysis usually need a paid plan.
Can portfolio software replace my broker app?
Not fully. Broker apps handle trading and official statements, while portfolio software adds a cross-broker view, income tracking and analysis. Most investors use both: the broker for trades, and a tracker for the full picture across accounts.
Does portfolio software handle taxes?
Sharesight and similar trackers produce tax reports on paid plans, but coverage varies by country and by tax rule. Always confirm your country is supported and have a tax professional review the output before filing, since rules change and edge cases exist.
How do I track property and crypto beside stocks?
Kubera is the strongest pick here, since it covers property, crypto, bank accounts and private holdings in one balance sheet. Stock-focused tools such as Simply Wall St and Stock Rover are weaker for non-stock assets, so match the tool to your asset mix.