Best Reporting Tools in 2026: 8 Tools Compared

- 1
 TableauPolished visual analysisVisit
- 2
 Power BIMicrosoft-centered teamsVisit
- 3
 Looker StudioFree Google-based reportingVisit
- 4
 Zoho AnalyticsAffordable all-round BIVisit
- 5
 SisenseEmbedded customer-facing analyticsVisit
- Looker Studio is our pick for small teams that want free, capable reporting tied to Google data.
- Tableau and Power BI lead for polished visuals and deep analysis, but both need more setup and budget.
- Metabase is the strongest low-cost option for teams that run their own servers and write some SQL.
- Klipfolio suits agencies and operations teams that live in dashboards built from spreadsheets and apps.
- Check connector coverage and per-user pricing before you commit, since those two factors drive most of the real cost.
Quick comparison
| Product | Ideal for | Price from | Free version | |
|---|---|---|---|---|
| Tableau | Polished visual analysis | See website | Free trial | Visit |
| Power BI | Microsoft-centered teams | See website | Yes | Visit |
| Looker Studio | Free Google-based reporting | Free | Yes | Visit |
| Zoho Analytics | Affordable all-round BI | See website | Free trial | Visit |
| Sisense | Embedded customer-facing analytics | See website | Free trial | Visit |
 Domo | All-in-one data platform | See website | Free trial | Visit |
 Metabase | Open source self-hosted BI | Free | Yes | Visit |
 Klipfolio | Spreadsheet-style dashboards | $120 per month | Free trial | Visit |
The best reporting tools
Good reporting turns scattered data into decisions people can act on. We compared official feature pages, pricing pages, app listings, and public reviews for the tools below, looking at connectors, chart quality, sharing controls, and total cost. Our list mixes enterprise platforms with lighter tools, so a solo analyst and a large company can both find a fit.
Tableau
Ideal for: Polished visual analysis
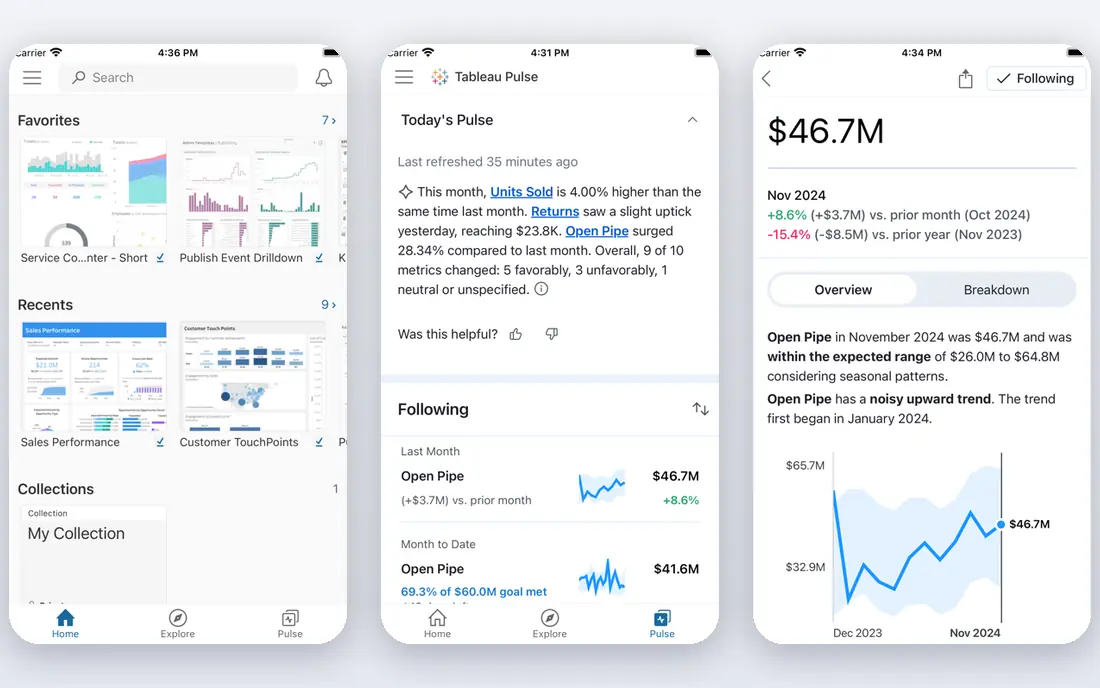
Tableau remains the reference point for visual reporting. Its drag-and-drop canvas makes it easy to build charts that look sharp in a board meeting, and its community shares a constant stream of example dashboards to learn from. For teams that present data to clients or executives, that polish is a real advantage.
The catch is cost and complexity. Pricing sits behind a sales conversation for most plans, and larger deployments often need someone who understands data modeling. If your reports are simple and your budget is tight, a lighter tool will serve you better.
- Excellent drag-and-drop visuals
- Strong community and learning resources
- Free Tableau Public option for public data
- Pricing is quote-based and can grow fast
- Advanced setup needs skilled analysts
Power BI
Ideal for: Microsoft-centered teams
Power BI is the natural choice if your company already runs on Microsoft 365. It connects cleanly to Excel, SharePoint, and Azure data, and the free desktop app lets one person build strong reports without paying anything. The example reports on Microsoft Learn also shorten the learning curve.
Sharing is where the bill arrives. Publishing reports for many viewers generally requires a paid Pro license or Premium capacity, so check who needs to view versus who needs to build. For a Microsoft shop with a clear viewer count, the value is hard to beat.
- Deep Microsoft 365 and Excel integration
- Free desktop app for building reports
- Huge template and example library
- Sharing reports widely usually needs paid capacity
- Licensing is confusing at first
Looker Studio
Ideal for: Free Google-based reporting
Looker Studio is our pick for most small teams. It is free, it connects to Google Sheets, Google Analytics, and many marketing platforms in minutes, and sharing a report is as simple as sending a link. For weekly marketing or sales reports, it covers nearly everything you need.
It is not a full enterprise BI platform. Very large data sets can feel slow, and some advanced modeling features found in Tableau or Power BI are absent. If your data lives in Google tools and your reports are straightforward, start here before paying for anything.
- Free to use
- Simple Google Sheets and Analytics connectors
- Easy sharing with a link
- Fewer advanced chart types
- Performance can dip with very large data sets
Zoho Analytics
Ideal for: Affordable all-round BI
Zoho Analytics packs a surprising amount into a mid-priced package. It connects to hundreds of business apps, databases, and files, and its AI assistant can suggest charts and explain changes in your data. Teams that already use Zoho apps get extra value from the shared sign-in and data flow.
The interface can feel crowded when you first open it, with many panels competing for attention. Plan a short learning period, and check which tier includes the connectors you need. For a growing business that wants real BI without enterprise pricing, it is a strong middle ground.
- More than 500 connectors
- AI-assisted chart building
- Good value next to larger rivals
- Interface feels busy in places
- Some advanced features need higher tiers
Sisense
Ideal for: Embedded customer-facing analytics
Sisense is built for a different job than most tools on this list. Instead of reports for your own staff, it powers analytics inside products your customers use, with your branding and your access rules. Its governed metrics layer helps keep every customer-facing number consistent, which matters when AI features answer questions from your data.
That focus makes it a poor fit for a team that only needs internal dashboards. Pricing requires a sales conversation, and implementation takes developer time. If you sell software and want analytics inside it, Sisense deserves a serious look.
- Strong embedded analytics for products
- Governed metrics keep numbers consistent
- Flexible APIs and SDKs
- Pricing is quote-based
- Overkill for simple internal reports
Domo
Ideal for: All-in-one data platform
Domo tries to cover the whole reporting journey, from connecting sources and cleaning data to building dashboards and adding AI agents. That breadth helps larger companies that want one vendor rather than several tools stitched together. Its mobile apps also make checking a dashboard on the go genuinely pleasant.
The trade-off is price and scope. Domo is aimed at mid-size and large organizations, and a small team may pay for capacity it never uses. Ask for a clear quote tied to your user count and data volume before deciding.
- Connectors, prep, and dashboards in one place
- AI agents for common tasks
- Strong mobile experience
- Enterprise pricing
- Smaller teams may find it more platform than they need
Metabase
Ideal for: Open source self-hosted BI
Metabase is our pick for technical teams on a budget. The open source edition is free to run on your own server, and its question builder lets non-technical colleagues explore data without writing SQL. You can also drop into SQL whenever a question gets complex, which keeps analysts happy.
Running it yourself means you own updates, backups, and security, so it suits teams with some engineering help. The paid cloud and enterprise plans add permissions and support for companies that want those handled. If you value control and low cost, Metabase is hard to argue against.
- Free open source edition you can self-host
- Friendly question builder for non-technical staff
- Clear pricing for cloud plans
- Self-hosting needs technical care
- Some enterprise features sit behind paid plans
Klipfolio
Ideal for: Spreadsheet-style dashboards
Klipfolio, now sold as Klips, speaks the language of spreadsheet users. If you think in formulas and cells, its dashboard builder will feel familiar, and it automates data pulls so your client or team dashboards stay current without manual copying. Agencies that report the same KPIs to many clients get particular value from its templates and sharing options.
The starting price of $120 per month puts it out of reach for a casual solo user, and it is less suited to open-ended data exploration than Tableau or Metabase. For operations and agency reporting, though, its focus is a strength rather than a limit.
- Familiar formula-based building
- Strong for client-facing KPI dashboards
- Automates data refreshes
- Starting price is high for solo users
- Less suited to deep ad hoc analysis
How we picked these
We compared official feature pages, pricing pages, and public documentation for each tool, plus app listings and public user reviews where they added context. We favored tools that are actively maintained in October 2026, connect to common business data sources, and offer a clear way to share reports with colleagues or clients. Pricing notes reflect what vendors publish on their own sites; where pricing sits behind a sales quote, we say so rather than guessing.
What to check before you choose a reporting tool
Start with your data sources, not the feature list. List every system your reports must pull from, such as your CRM, accounting app, ad platforms, and spreadsheets, then confirm each shortlisted tool connects to all of them without an expensive add-on. A tool with beautiful charts is little use if half your data needs manual exports.
Next, count your builders and your viewers separately. Many vendors charge differently for people who create reports and people who only read them, and that split decides the real monthly bill. Ask for a quote based on your actual headcount, and test the free plan or trial with your own data before signing.
Finally, think about who will maintain the reports. A tool your analyst loves but nobody else can edit becomes a bottleneck when that person is away. Pick the simplest tool that covers your sources, your sharing needs, and your budget, and keep a short list of must-have charts to test during the trial.
Frequently asked questions
What is the best reporting tool for a small business?
Looker Studio is the best starting point for most small businesses because it is free and connects well to Google Sheets, Analytics, and common marketing tools. Zoho Analytics is a good next step when you need more connectors and stronger analysis. Metabase fits technical teams that want to self-host at low cost.
Is there a completely free reporting tool?
Yes. Looker Studio is free, and the open source edition of Metabase is free to self-host. Power BI Desktop is also free for building reports on your own computer. Free plans usually limit sharing or advanced features, so check those limits against your needs.
What is the difference between reporting tools and BI platforms?
Reporting tools focus on presenting data in dashboards and scheduled reports, while BI platforms add deeper analysis, data modeling, and governance. Many products on this list do both, and the line between them has blurred. Choose based on whether you need simple presentation or deeper exploration.
How much do reporting tools cost?
Prices range from free for Looker Studio and self-hosted Metabase to quote-based enterprise pricing for Tableau, Sisense, and Domo. Klipfolio lists a starting price of $120 per month. Always ask for a quote based on your builder and viewer counts.
Do I need to know SQL to use a reporting tool?
No. Most tools here offer drag-and-drop builders or plain-language questions for everyday reports. SQL helps for complex analysis in Metabase, Tableau, and Power BI, but small teams can build useful dashboards without it.