Best Netdata Alternatives in 2026: 8 Tools Compared

- Datadog and New Relic are the fullest replacements, covering infrastructure, apps, and logs in one platform.
- Grafana plus Prometheus is the leading open-source stack for teams that want control and low license cost.
- Zabbix, Nagios, and Checkmk suit traditional server and network monitoring with on-premises control.
- PRTG fits Windows-centered shops that want monitoring up fast with sensors.
- Netdata's strength is per-second, single-node detail, so check granularity before switching.
Quick comparison
| Product | Ideal for | Price from | Free version | |
|---|---|---|---|---|
 Datadog | Full-stack observability in one platform | See website | Free trial | Visit |
 Grafana | Dashboards over any metrics source | See website | Yes | Visit |
 Prometheus | Open-source metrics collection and alerting | Free | Yes | Visit |
 Zabbix | On-premises server and network monitoring | Free | Yes | Visit |
 Nagios | Classic host and service monitoring | Free | Yes | Visit |
 New Relic | Application plus infrastructure monitoring | See website | Yes | Visit |
 Checkmk | Infrastructure monitoring at scale | See website | Free trial | Visit |
 PRTG Network Monitor | Sensor-based monitoring for Windows shops | See website | Free trial | Visit |
The best Netdata alternatives
Netdata stands out for real-time, per-second metrics on a single machine with almost no setup. Alternatives trade some of that instant granularity for broader coverage, longer retention, alerting depth, or a managed service. The right replacement depends on whether you monitor a few servers, a whole fleet, or full applications.
Datadog
Ideal for: Full-stack observability in one platform
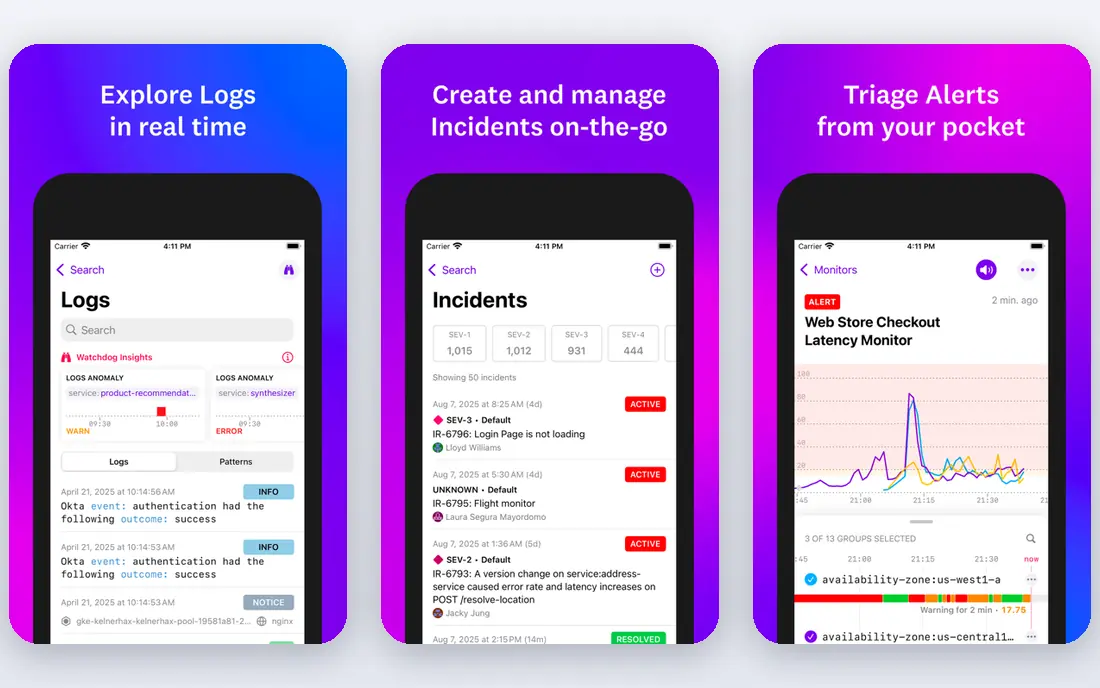
Datadog is the most complete replacement for teams that outgrow single-node monitoring. One agent collects host metrics, application traces, logs, and synthetic checks, and the dashboards tie them together so a slow endpoint can be traced to a saturated host in a few clicks. The integration library covers nearly every common service.
Cost is the recurring complaint. Datadog charges across several product lines, and metric and log volume can push bills up quickly if retention and ingestion are not managed. For teams that need the full picture in one managed platform and can watch usage, Datadog is our pick for most people.
- Infrastructure, APM, logs, and synthetics in one place
- Huge integration library
- Strong alerting and dashboards
- Pricing is complex and can grow fast
- Metric volume needs management
Grafana
Ideal for: Dashboards over any metrics source

Grafana is the visualization layer most monitoring stacks standardize on. It turns metrics from Prometheus, cloud providers, and databases into dashboards and alerts that look good and are easy to share. The open-source core is free, and Grafana Cloud offers a hosted path for teams that do not want to run it themselves.
Grafana alone does not collect metrics, so it pairs with Prometheus or another backend, which adds setup compared with Netdata's single-agent install. If you want beautiful dashboards, flexible alerting, and freedom to change backends later, Grafana is the centerpiece of the best open-source replacement.
- Excellent dashboards and alerting
- Works with Prometheus, cloud, and many sources
- Free open-source core
- Needs a metrics backend such as Prometheus
- Setup takes more effort than Netdata
Prometheus
Ideal for: Open-source metrics collection and alerting
Prometheus is the default open-source metrics system for cloud-native infrastructure. It scrapes metrics from exporters, stores time series, and lets you query them with PromQL, while Alertmanager handles routing and silencing. The ecosystem is huge, so most software already exposes Prometheus metrics.
Retention and scale are the limits. Local storage suits weeks to months of data, and very large fleets need federation or remote storage such as Thanos or Cortex. Paired with Grafana for dashboards, Prometheus is the free, controllable core of a serious monitoring stack.
- Free and widely adopted
- Powerful query language
- Strong alerting with Alertmanager
- Local storage limits long retention
- Scaling needs extra components
Zabbix
Ideal for: On-premises server and network monitoring
Zabbix is the traditional answer for teams that want full control on their own servers. Agents collect host metrics, agentless checks cover network devices, and templates make it quick to monitor common services. Alerting, escalation, and visualization are all built in, with no per-host license cost.
The interface shows its age, and initial tuning takes effort, especially for large environments. For organizations that prefer on-premises software, need to monitor networks as well as servers, and want no usage-based billing, Zabbix remains a dependable, free choice.
- Free and open source
- Agent and agentless checks
- Strong templates and alerting
- Interface feels dated
- Setup and tuning take time
Nagios
Ideal for: Classic host and service monitoring
Nagios is the grandparent of infrastructure monitoring, and its plugin model is still its strength. Thousands of community plugins check nearly anything, from disk space to custom application endpoints, and the core remains free. Nagios XI, the commercial edition, adds a modern interface, dashboards, and reporting for teams that want more polish.
Configuration is manual and file-based in the core, which feels slow next to auto-discovery tools. For teams that already know Nagios, or that need a specific plugin no other tool offers, it is still a viable, low-cost option.
- Long track record
- Huge plugin library
- Nagios XI adds dashboards and reporting
- Dated interface in the free core
- Configuration is file-based and manual
New Relic
Ideal for: Application plus infrastructure monitoring
New Relic competes directly with Datadog for full-stack observability, with infrastructure monitoring, application performance monitoring, logs, and errors in one platform. The free tier is genuinely useful for small setups, and setup is fast, with agents and guided installs for common stacks.
As with Datadog, pricing deserves attention once data volume grows, and some advanced features require higher tiers. For teams that care as much about application performance as host metrics, and that want a free tier to start with, New Relic is a strong alternative to both Netdata and Datadog.
- Full-stack observability with a free tier
- Strong APM and error tracking
- Quick setup
- Pricing tiers and data limits need care
- Some features sit behind higher plans
Checkmk
Ideal for: Infrastructure monitoring at scale
Checkmk grew out of the Nagios ecosystem and kept its strengths while adding auto-discovery, which is the feature that saves the most time in large environments. Point it at a network and it finds hosts and services, applies rules, and starts monitoring with far less manual configuration than Nagios core. The raw edition is free and open source.
The interface is dense and takes a few days to learn, and the most polished features sit in the paid enterprise edition. For mid-size and large fleets that want on-premises monitoring with less manual setup than Nagios or Zabbix, Checkmk is a smart middle path.
- Auto-discovery of hosts and services
- Scales to large fleets
- Free raw edition available
- Interface takes learning
- Enterprise features need a paid edition
PRTG Network Monitor
Ideal for: Sensor-based monitoring for Windows shops
PRTG, from Paessler, organizes monitoring into sensors, where each sensor checks one thing, such as CPU load, a web page, or a switch port. Auto-discovery builds a sensor map quickly, and the model is easy to explain to non-specialists. It is popular in Windows-centered shops and smaller networks that want monitoring running the same day.
The core server runs on Windows, which matters for Linux-only shops, and sensor-based pricing means broad coverage costs more. For small and mid-size networks that want quick setup and clear, sensor-by-sensor visibility, PRTG is a practical choice.
- Fast setup with auto-discovery
- Sensor model is easy to grasp
- Good Windows and network coverage
- Windows server required for the core
- Sensor-based pricing can grow with coverage
How we picked these
We compared official feature pages, pricing pages, documentation, and public reviews for each tool, and we checked that each product is actively offered in October 2026. We kept tools that collect infrastructure metrics and alert on problems, and we spread the list across managed observability platforms, open-source stacks, and traditional on-premises monitors. We did not include log-only tools or uptime checkers that cannot monitor host resources.
What to check before you switch
Monitoring switches fail most often on granularity, retention, and alert noise, so test those three.
Metric granularity and retention
Netdata shows per-second data, while many platforms default to coarser intervals. Check the default collection interval and how long high-resolution data is kept, since a problem that lasts thirty seconds may vanish in minute-level averages.
Alert quality
Set up your five most important alerts in the trial and run them against a real incident. A monitoring tool that pages you for noise, or stays quiet during a real outage, is worse than no tool at all.
Cost at your host count
Model pricing for your real host, container, and metric counts. Usage-based platforms can cost far more than a per-host estimate suggests, while open-source tools cost engineering time instead.
Before you commit, run your top two choices side by side on the same servers for at least two weeks. That trial window shows whether alerts fire at the right times, whether dashboards stay readable under load, and whether the agent adds noticeable CPU or memory overhead. Pay attention to data retention too: a tool that keeps only a few days of history will frustrate post-incident review, while long retention can raise storage costs. Check how alerts reach your team, whether on-call schedules and escalation rules are built in, and whether alert noise can be tuned without hiding real problems. Finally, confirm that the pricing model fits your host count as you grow, since per-host pricing can climb fast in larger fleets.
Frequently asked questions
What is the closest free alternative to Netdata?
Prometheus with Grafana is the closest free stack, though it needs more setup than Netdata's single agent. Zabbix is the closest free all-in-one monitor, with agents, alerting, and dashboards included.
Do I need both Prometheus and Grafana?
Not strictly, but they are usually paired. Prometheus collects and stores metrics and handles alerting, while Grafana provides dashboards and visualization. Grafana can also read other sources, so you can swap the backend later.
Which Netdata alternative is easiest to set up?
PRTG and Datadog are among the fastest, with auto-discovery and guided installs. Netdata itself remains the fastest single-node install, so expect any fleet tool to take a bit longer.
Can these tools monitor Docker and Kubernetes?
Yes, all eight handle containers to some degree, with Prometheus, Datadog, and New Relic offering the deepest Kubernetes support. Check the specific exporters or agents for your setup before committing.
How long should I keep monitoring data?
Keep high-resolution data for days to weeks for incident investigation, and downsampled data for months for trend analysis. Most managed platforms handle this automatically, while self-hosted tools need retention settings configured by hand.