Best Site24x7 Alternatives in 2026: 8 Monitoring Tools Compared

- 1
 DatadogFull-stack monitoringVisit
- 2
 New RelicApplication and infrastructureVisit
- 3
 UptimeRobotSimple uptime checksVisit
- 4
 PingdomUptime and page speedVisit
- 5
 StatusCakeAffordable uptime monitoringVisit
- Datadog and New Relic suit teams that want deep infrastructure, application, and log monitoring in one platform.
- UptimeRobot, Pingdom, and StatusCake suit teams that mainly need reliable uptime and page speed checks.
- Better Stack suits teams that want uptime monitoring plus status pages and incident handling in one tool.
- Zabbix and PRTG suit teams that want self-hosted or network-heavy monitoring with fine control.
- All eight tools offer alerts, but escalation, on-call, and status page features vary, so check those before committing.
Quick comparison
| Product | Ideal for | Price from | Free version | |
|---|---|---|---|---|
| Datadog | Full-stack monitoring | See website | See website | Visit |
| New Relic | Application and infrastructure | See website | See website | Visit |
| UptimeRobot | Simple uptime checks | See website | Yes | Visit |
| Pingdom | Uptime and page speed | See website | Free trial | Visit |
| StatusCake | Affordable uptime monitoring | See website | Yes | Visit |
 Better Stack | Uptime plus status pages | See website | See website | Visit |
 Zabbix | Self-hosted monitoring | See website | Yes | Visit |
 PRTG Network Monitor | Network monitoring | See website | Free trial | Visit |
The best Site24x7 alternatives
Site24x7 monitors websites, servers, networks, and cloud services from one console. The tools below cover similar ground, and they differ in depth, hosting style, and price. Some are full observability platforms for engineering teams, some focus on simple uptime checks, and some are built for network devices. The right pick depends on what you monitor and how much detail you need when something breaks.
Datadog
Ideal for: Full-stack monitoring
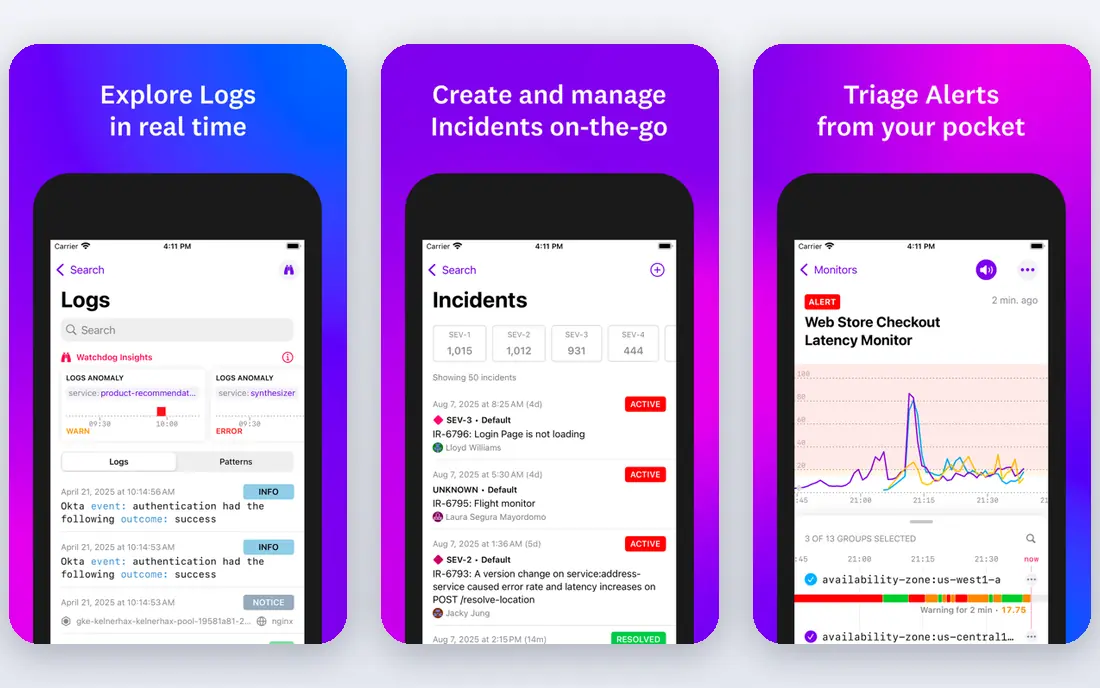
Datadog brings infrastructure metrics, application traces, logs, and security signals into one platform with hundreds of integrations. Dashboards can combine server health, app latency, and business metrics, which helps teams trace an outage from a user complaint to a failing service. Alerting supports thresholds, anomaly detection, and team routing.
Pricing is complex, with separate meters for hosts, logs, and custom metrics, so costs can grow faster than expected. Smaller teams may find the breadth more than they need. For engineering organizations that want one observability platform, Datadog is our pick for most teams.
- Infrastructure, apps, logs, and security in one platform
- Huge integration library
- Strong dashboards
- Pricing is complex and can grow fast
- Learning curve for new teams
New Relic
Ideal for: Application and infrastructure
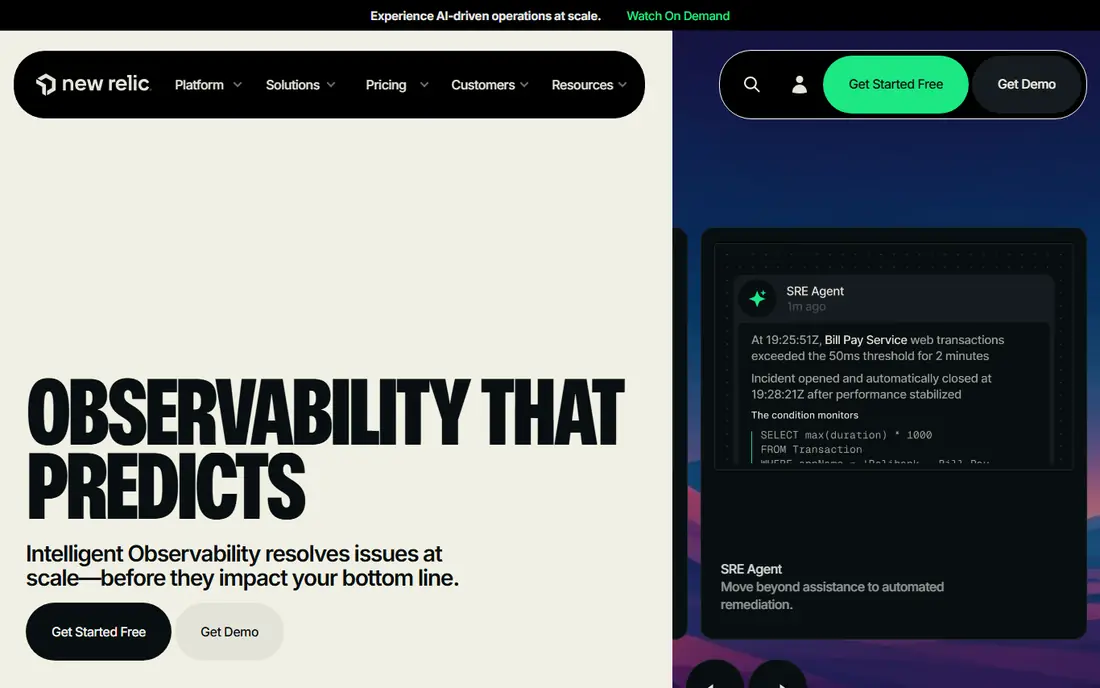
New Relic covers application performance, infrastructure, logs, and browser monitoring from a single agent and console. Its application views show slow transactions, errors, and database calls in terms developers can act on, which speeds up debugging. The platform also handles synthetic checks and real user monitoring.
The pricing model, based on data ingest and users, takes study to predict. Some advanced features sit on higher tiers. For teams centered on application performance, New Relic is a strong alternative.
- Full-stack observability
- Generous free tier history
- Clear application performance views
- Pricing model takes study
- Some features need higher tiers
UptimeRobot
Ideal for: Simple uptime checks
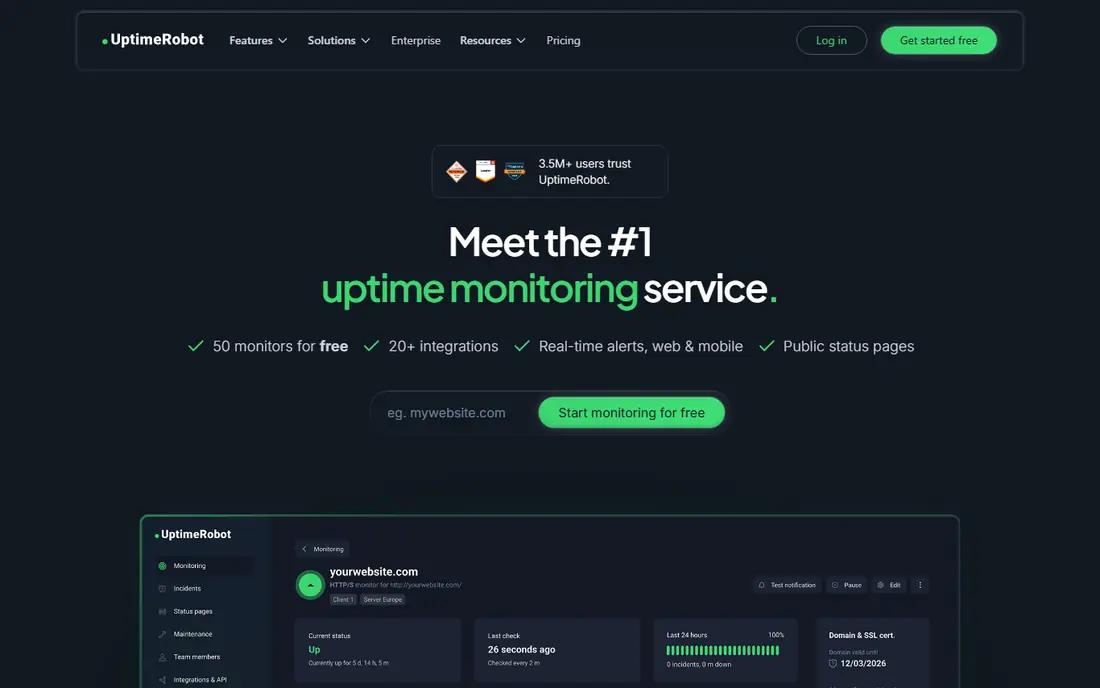
UptimeRobot does one job well: it checks whether your websites, ports, and services respond, from many locations, and alerts you when they do not. Setup takes minutes, and status pages let you share uptime with customers. The free tier covers basic monitoring for small sites.
It lacks the deep metrics, logs, and tracing of full observability platforms, and advanced check types need paid plans. For small sites and teams that mainly need to know when something goes down, UptimeRobot is a practical pick.
- Easy setup
- Checks from many locations
- Clear status pages
- Less depth than full platforms
- Advanced checks need paid plans
Pingdom
Ideal for: Uptime and page speed
Pingdom, part of SolarWinds, is a long-running uptime and performance monitor with checks from locations around the world. Page speed reports show what slows a page, from large images to slow third-party scripts, which helps front-end teams directly. Alerts reach email, SMS, and common chat tools.
Scope is narrower than Datadog or New Relic, since Pingdom focuses on external checks rather than deep server internals. Pricing per check can add up for large estates. For teams that care most about external availability and speed, Pingdom is a dependable choice.
- Reliable uptime checks
- Page speed insights
- Long track record
- Narrower scope than full platforms
- Pricing per check adds up
StatusCake
Ideal for: Affordable uptime monitoring
StatusCake offers uptime monitoring, page speed checks, and domain and SSL expiry alerts at approachable prices, with unlimited tests on some plans. Status pages are included, which helps small teams communicate outages without a separate tool. Setup is quick, and checks run from many locations.
The interface is less polished than the leaders, and the integration library is smaller. For small businesses that want solid uptime coverage on a budget, StatusCake is good value.
- Affordable plans
- Unlimited tests on some plans
- Status pages included
- Interface less polished than leaders
- Fewer integrations
Better Stack
Ideal for: Uptime plus status pages
Better Stack combines uptime monitoring with status pages, incident management, and on-call scheduling, so a small team can handle the full outage workflow in one tool. Optional log monitoring adds server and application logs alongside checks. The interface is modern and fast.
As a newer vendor, its log features are less deep than dedicated observability platforms. For teams that want uptime, status pages, and incident handling together, Better Stack is a strong modern pick.
- Uptime checks plus status pages
- Incident management
- Log monitoring options
- Newer vendor
- Log features are less deep than dedicated platforms
Zabbix
Ideal for: Self-hosted monitoring
Zabbix is an open-source monitoring platform you host yourself, with templates for servers, networks, cloud services, and applications. Its flexibility suits teams with unusual devices or strict data control needs, since data stays on your own servers. The template library covers thousands of device types.
Self-hosting means your team handles setup, upgrades, and scaling, and the interface feels dated next to cloud tools. For organizations that want control and no per-device subscription, Zabbix is the leading open option.
- Free open-source core
- Very flexible templates
- Huge device coverage
- Setup and maintenance take effort
- Interface feels dated
PRTG Network Monitor
Ideal for: Network monitoring
PRTG monitors networks with a sensor model: each device contributes sensors for traffic, uptime, disk, and services, and auto-discovery builds the initial map quickly. Network maps and alerts give infrastructure teams a clear view of switches, routers, servers, and applications. A free tier covers smaller sensor counts.
The core server runs on Windows, which matters for Linux-centered shops, and sensor-based pricing grows with device count. For network-focused teams, PRTG is a proven pick.
- Sensor-based network monitoring
- Auto-discovery
- Clear maps and alerts
- Windows-based server
- Sensor pricing can grow with device count
How we picked these
We compared official feature pages, pricing, check types, and public reviews for each tool, and we checked that each product is actively offered in October 2026. We favored tools with reliable alerting and real monitoring depth, and we kept a mix of full observability platforms, simple uptime checkers, and network monitors. We left out tools with no working trial or signup and tools that have shut down.
How to choose a monitoring tool
Monitoring fails quietly when alerts are noisy or coverage has gaps, so test the workflow, not just the dashboard.
Map what must be watched
List every website, API, server, database, and network device that would page someone at night. Check that the tool covers each type, since uptime checkers watch external availability while infrastructure tools watch internal health. Gaps usually hide in SSL certificates, domain expiry, and background jobs, so include those explicitly.
Test the alert path
Trigger a test outage and follow the alert from detection to your phone, chat, or on-call rotation. Check escalation rules, quiet hours, and whether alerts group related failures instead of flooding the channel. A tool that detects fast but alerts badly still leaves you blind at 3 a.m.
Watch the cost as you scale
Model pricing for your full estate, including hosts, checks, logs, and users, since per-unit pricing climbs with growth. Self-hosted tools avoid subscriptions but add maintenance time, which is also a cost. Revisit the model each year, since estates grow and pricing tiers change.
Alert design decides whether a monitoring tool helps or just adds noise. Set thresholds from real incident history rather than defaults, and give each alert a named owner and a next step. Maintenance windows matter for planned deploys, since alerts during a deploy teach teams to mute the channel. Escalation paths should cover nights and holidays, with a second contact when the first does not respond. A public status page, updated from the same checks, keeps customers informed without extra tickets and shows the work your team already does.
Check locations and frequency involve trade-offs worth pricing out. More locations catch regional outages sooner, but each extra probe adds cost and data to review. Match check frequency to the service: a checkout page deserves minute-level checks, while a marketing page may not. Private probes inside your network catch internal failures that public checks miss, so teams with internal tools should confirm that option. Keep historical uptime data for contract reviews, since a year of check history settles most arguments about reliability.
Frequently asked questions
What is Site24x7?
Site24x7 is a monitoring service from ManageEngine that watches websites, servers, networks, applications, and cloud services. The tools here offer similar monitoring with different emphasis on depth, hosting, and price.
Which Site24x7 alternative is best for small websites?
UptimeRobot, StatusCake, and Pingdom suit small websites, since they focus on uptime and page speed checks with quick setup. Better Stack also fits small teams that want status pages and incident handling included.
Do I need a full observability platform?
Not always. If you run a few websites, uptime checks plus a status page are enough. Full platforms like Datadog and New Relic pay off when you run many services and need to trace failures across servers, applications, and logs.
What is the difference between uptime monitoring and infrastructure monitoring?
Uptime monitoring checks from outside whether a site or service responds. Infrastructure monitoring watches internal health, such as CPU, memory, disk, and application errors. Many teams use both, since a site can respond while its servers struggle.
Can these tools send alerts to Slack or email?
Yes, most of them alert through email, chat tools, SMS, and webhooks, and several support on-call rotations. Check the integrations page for your exact chat or incident tool before committing.