Best Swarmia Alternatives in 2026: 8 Tools Compared

- LinearB and Jellyfish are the most complete picks for engineering leaders who want team and delivery insights.
- Waydev and GitClear suit teams that want clear delivery metrics without heavy setup.
- Hatica gives managers project health and planning accuracy views in one place.
- Code Climate Velocity combines delivery metrics with code quality views.
- Multitudes and Allstacks fit organizations that want delivery, quality, and wellbeing views together.
Quick comparison
| Product | Ideal for | Price from | Free version | |
|---|---|---|---|---|
 LinearB | Engineering team insights | See website | Free trial | Visit |
 Jellyfish | Executive engineering views | See website | Free trial | Visit |
 Waydev | Delivery metrics | See website | Free trial | Visit |
 Hatica | Project health and planning | See website | See website | Visit |
 Code Climate Velocity | Delivery plus code quality | See website | Free trial | Visit |
 GitClear | Durable code change metrics | See website | See website | Visit |
 Multitudes | Team wellbeing and quality | See website | See website | Visit |
 Allstacks | Software delivery intelligence | See website | Free trial | Visit |
The best Swarmia alternatives
Swarmia helps engineering teams see how work flows from plan to production, with metrics on pull requests, reviews, and deployments. The tools below cover similar ground, and they differ in depth, focus, and price. Some aim at engineering managers, some at executives, and some at teams that want a lighter view of delivery health.
LinearB
Ideal for: Engineering team insights
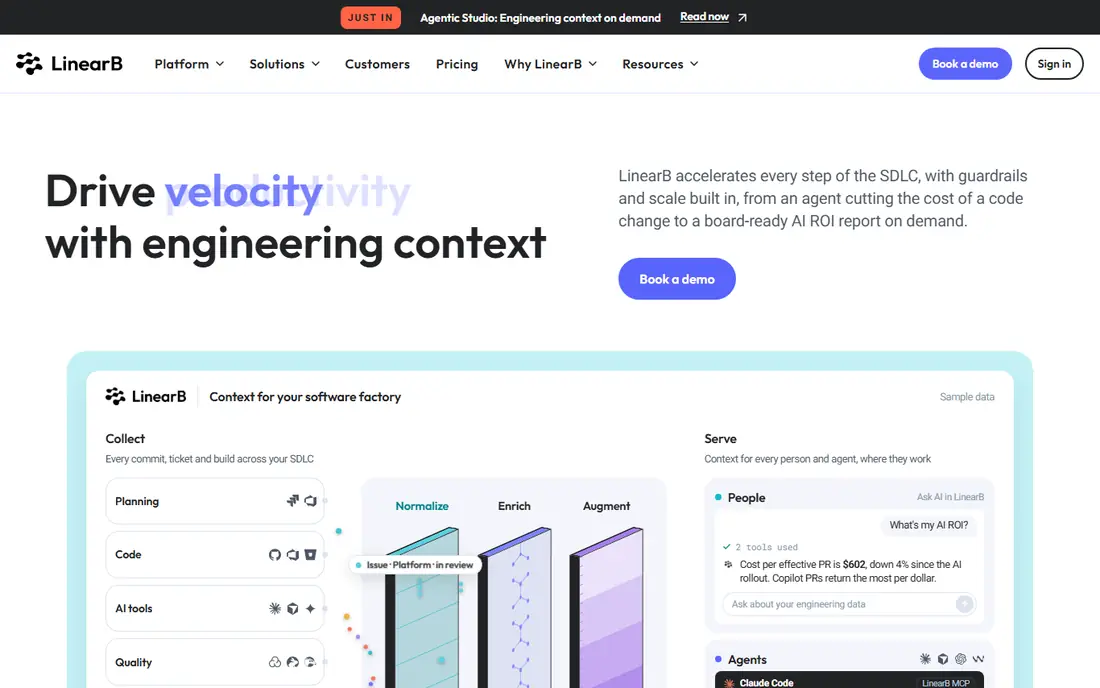
LinearB pulls data from Git repositories and project tools to show cycle time, review time, deployment frequency, and team workload. Managers can spot bottlenecks, such as reviews waiting too long, and automate routine steps like reminding reviewers or updating project status. The dashboards are clear enough for weekly team reviews.
The main caution is that metrics alone do not explain why work slows down, so teams should pair numbers with conversation. Pricing is not fully published, so larger teams should ask for a quote. For engineering managers who want a complete, team-level view, LinearB is our pick for most teams.
- Strong team and project metrics
- Workflow automation
- Good Git and project tool integrations
- Pricing is quote-based for larger teams
- Some metrics need careful interpretation
Jellyfish
Ideal for: Executive engineering views
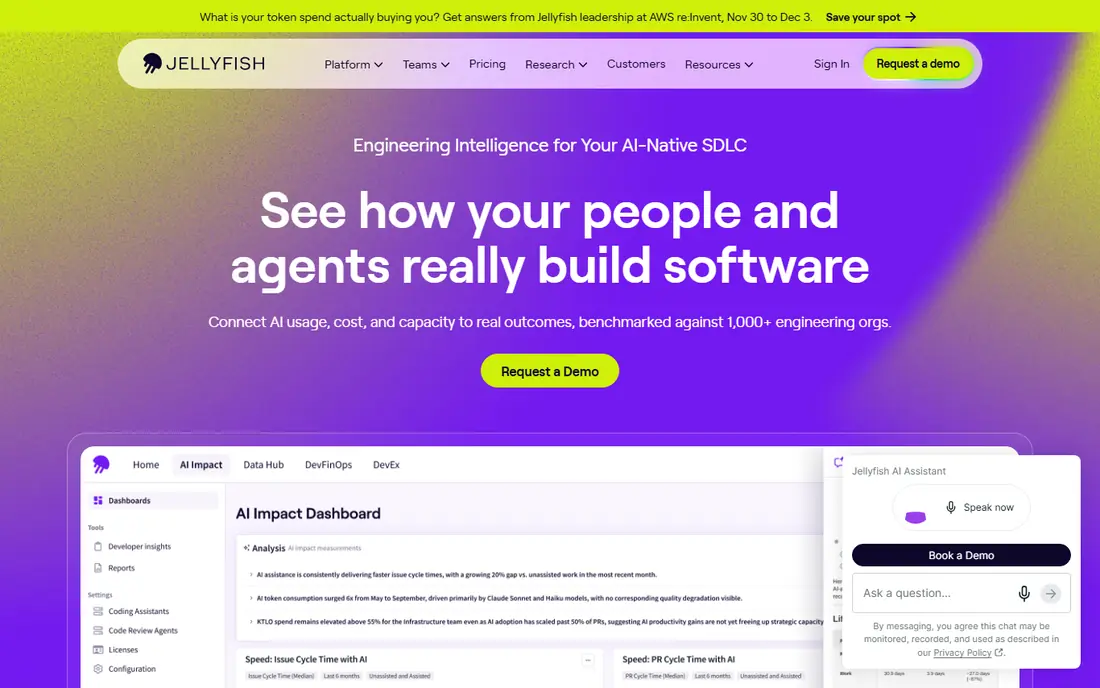
Jellyfish is built for leaders who need to explain engineering work in business terms. It maps engineering effort to products, initiatives, and goals, so executives can see where time goes and whether it matches strategy. Allocation views show how much effort goes to new features, upkeep, and unplanned work.
That breadth comes with enterprise pricing and a setup phase to map teams and work types. Smaller teams may find it more than they need. For organizations that report engineering investment to the board, Jellyfish is a strong choice.
- Connects engineering work to business goals
- Strong allocation and investment views
- Executive-ready reports
- Enterprise pricing
- Setup and data mapping take time
Waydev
Ideal for: Delivery metrics
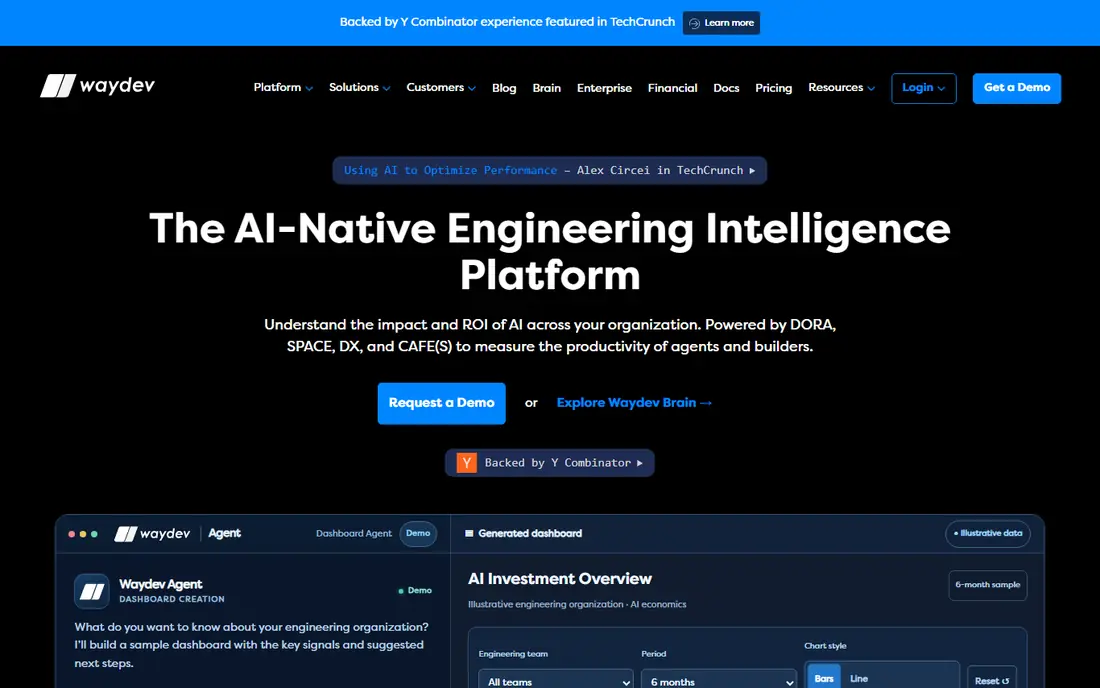
Waydev focuses on delivery metrics that engineering teams actually use: deployment frequency, lead time, review time, and throughput. Setup connects to Git providers quickly, and the dashboards work for both managers and individual contributors who want to see their own flow.
It is less focused on tying work to business outcomes than Jellyfish, so executive reporting needs extra work. For teams that want solid delivery metrics without a long implementation, Waydev is a practical pick.
- Clear DORA and delivery metrics
- Easy setup with Git tools
- Team and individual views
- Less depth on business alignment than Jellyfish
- Advanced features need higher plans
Hatica
Ideal for: Project health and planning
Hatica gives engineering managers a project health view that brings sprint, project, and engineering metrics into one screen. Investment allocation shows where engineers spend time, and planning accuracy compares planned work with what actually shipped. Together these views help managers spot drift early and adjust plans before a sprint ends.
Hatica connects to Git, project, CI/CD, communication, and incident tools, so the picture covers more than code alone. Pricing is not fully published, so teams should ask for a quote. For managers who want health, allocation, and planning views together, Hatica is a strong pick.
- Project health and sprint views
- Investment allocation
- Planning accuracy tracking
- Pricing is quote-based
- Best value comes with regular manager review
Code Climate Velocity
Ideal for: Delivery plus code quality
Code Climate Velocity adds a useful angle: it pairs delivery metrics with code quality analysis from the same vendor. Teams can see review times and throughput next to maintainability grades and test coverage trends, which helps when a fast team is building up technical debt.
Quality grades can be misread if managers treat them as individual scores, so teams should use them for coaching, not ranking. For teams that want delivery and quality in one place, Velocity is a good fit.
- Combines delivery metrics with code quality grades
- Pull request analytics
- Useful for review health
- Quality grades need context to avoid misuse
- Setup takes some tuning
GitClear
Ideal for: Durable code change metrics
GitClear measures developer output by scoring durable code change rather than raw lines written, and it can attribute lines to the AI tools that produced them. That approach suits teams that want to know whether AI coding help is producing code that lasts, and where rework and defects cluster. Its scorecards compare AI-assisted and human-authored work on the same yardstick.
The AI focus means teams that do not use AI coding tools will use only part of the product. For teams weighing AI tool spend or tracking code durability, GitClear offers a distinct, data-first view.
- Line-level code attribution
- Durable change scoring
- AI tool ROI views
- AI-focused angle may suit some teams more than others
- Pricing details are limited on the homepage
Multitudes
Ideal for: Team wellbeing and quality
Multitudes tracks classic delivery measures like DORA, SPACE, and DevEx, then adds wellbeing and code quality signals, including early warnings when AI-assisted work hurts review quality. Coaching questions and action nudges help managers turn the data into conversations with their teams.
That broader lens suits leaders who care about sustainable pace as much as speed. Pricing is not fully published, so teams should ask for a quote. For teams that want delivery, quality, and wellbeing in one view, Multitudes is a thoughtful option.
- Goes beyond DORA with wellbeing and quality signals
- Coaching nudges for managers
- AI risk indicators
- Newer vendor with a smaller community
- Pricing is quote-based
Allstacks
Ideal for: Software delivery intelligence
Allstacks gives multi-team organizations a shared view of delivery health, with forecasting and risk signals that flag projects drifting off track. Managers can compare teams, spot stalled work, and plan capacity with a common set of metrics.
It is less well known than LinearB or Jellyfish, so the community and integration library are smaller. For organizations running many teams that need one delivery picture, Allstacks is worth a trial.
- Delivery intelligence across projects
- Forecasting and risk views
- Good for multi-team orgs
- Less known than bigger rivals
- Pricing is quote-based
How we picked these
We compared official feature pages, pricing pages, documentation, and public reviews for each tool, and we checked that each product is actively offered in October 2026. We favored tools that measure engineering delivery from real Git and project data, and we kept a mix of manager, executive, and lightweight options. We left out generic business dashboards with no engineering data and tools that have shut down.
What to check before you switch
Engineering metrics can help teams or harm trust, depending on how they are used, so test thoughtfully.
Data connections
Connect your real Git and project tools during the trial and check that the metrics match what you know. Missing repositories, mislabeled work types, and bot activity can all skew results, so clean the inputs before judging the output.
Metric use
Decide in advance how metrics will be used, and share that with the team. Metrics work best for finding bottlenecks and improving flow, and they backfire when used to rank individuals. Pick a tool whose reports support team conversations, not surveillance.
Cost and scale
Model the cost for your team count and data sources, since several tools price by quote. Also check how the tool handles multiple teams and repositories, since a tool that works for one team may struggle across an organization.
Rolling out engineering metrics works best with a baseline period where the team sees the data before any goals are attached to it. That quiet period builds trust and reveals data problems, such as bot commits or mislabeled work, before anyone feels judged. Share the dashboards with the whole team, not only managers, and agree in writing on how metrics will and will not be used. Revisit the setup each quarter, since team structure and tooling change, and stale mappings quietly distort results. A tool that supports honest conversation about bottlenecks is worth more than one with the prettiest charts.
Engineering metrics work best when a team agrees on what each number means before anyone opens a dashboard. Cycle time, review time, and deployment frequency can each be measured in several ways, and two tools will rarely match unless you set the definitions first. Start with one team and one quarter of data, then review the results together in a retrospective rather than in a performance review. Pair delivery numbers with code review quality and incident notes, since speed alone hides rework. Avoid ranking individual engineers from these tools, because that habit quickly teaches people to game the metric instead of improving the work.
Frequently asked questions
What is Swarmia?
Swarmia is an engineering analytics tool that shows how software work flows from planning to production, with metrics on pull requests, reviews, deployments, and team habits. The tools here provide similar visibility into engineering delivery.
Which Swarmia alternative is best for small teams?
Waydev and GitClear are good small-team picks, since they set up quickly and focus on delivery metrics. LinearB also works for small teams, though its full value shows more as teams grow.
Do these tools measure individual developers?
They can show individual activity, but most vendors recommend using metrics at team level. Individual numbers miss context such as review load, mentoring, and hard problems, so use them for coaching conversations, not rankings.
What are DORA metrics?
DORA metrics are four measures of software delivery: deployment frequency, lead time for changes, change failure rate, and time to restore service. Waydev, Multitudes, and most tools here track them, and they are a good starting point for delivery health.
Can these tools replace project management software?
No. They analyze data from project and Git tools rather than replacing them. You still need a system for planning work, and these tools sit on top of it to show how that work flows.