8 Best Tableau Alternatives for Data Visualization

- 1
 Microsoft Power BIOverall Microsoft integration and communityVisit
- 2
 Looker StudioFree Google dashboardsVisit
- 3
 Qlik SenseAssociative exploration without fixed query pathsVisit
- 4
 DomoCloud BI with embedding and business appsVisit
- 5
 SisenseEmbedded analytics and data pipelinesVisit
- Microsoft Power BI is the best overall Tableau alternative, with deep Microsoft integration and a huge user community.
- Looker Studio is the best free option, with Google Sheets and BigQuery connections at no cost.
- Qlik Sense suits teams that want associative exploration, letting users click through data in any direction.
- Domo and Sisense suit businesses that want cloud BI with strong embedding and data pipeline tools.
- Metabase suits teams that want open-source analytics with a simple question builder.
- Zoho Analytics suits small businesses that want affordable BI inside the Zoho suite.
- Looker suits enterprises that want governed metrics through a semantic layer.
- The right choice depends on your data stack: Microsoft shops lean Power BI, Google shops lean Looker Studio or Looker.
Quick comparison
| Product | Ideal for | Price from | Free version | |
|---|---|---|---|---|
| Microsoft Power BI | Overall Microsoft integration and community | See website | See website | Visit |
| Looker Studio | Free Google dashboards | Free to use | Yes | Visit |
| Qlik Sense | Associative exploration without fixed query paths | See website | See website | Visit |
| Domo | Cloud BI with embedding and business apps | See website | No | Visit |
| Sisense | Embedded analytics and data pipelines | See website | No | Visit |
 Metabase | Open-source analytics with a simple question builder | See website | Yes | Visit |
 Zoho Analytics | Affordable BI inside the Zoho suite | See website | See website | Visit |
 Looker | Governed enterprise metrics through a semantic layer | See website | No | Visit |
The best Tableau alternatives
Microsoft Power BI
Ideal for: Overall Microsoft integration and community

Microsoft Power BI is the leading Tableau alternative for most organizations, turning spreadsheets, databases, and cloud sources into interactive dashboards and reports, with AI visuals, natural-language questions, and sharing through Teams and SharePoint. Its Microsoft integration is unmatched: Excel users can move to Power BI without learning a new data model.
Power BI is our top pick because it balances power, price, and familiarity. Most business users already know Excel, the community answers questions fast, and the enterprise features cover governance, row-level security, and deployment pipelines. Check current licensing on Microsoft's site, since plans and prices change.
- Deep Excel, Teams, and Azure integration, huge community and template library, AI visuals, strong enterprise governance
- Best on Windows and Microsoft stacks, pricing varies by license, advanced features need premium capacity
Looker Studio
Ideal for: Free Google dashboards
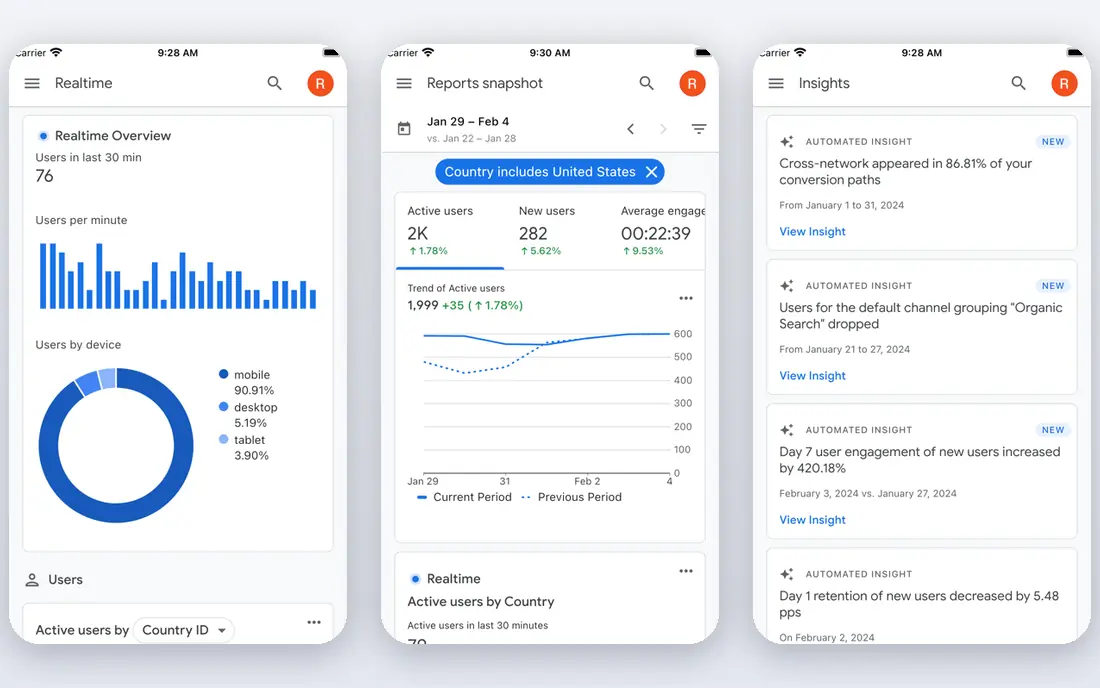
Looker Studio, formerly Google Data Studio, is Google's free dashboard and reporting tool, connecting to Sheets, Analytics, BigQuery, and hundreds of partner sources to build shareable, interactive reports. It runs in the browser, shares with a link, and suits teams that already live in Google Workspace.
Looker Studio is the best free Tableau alternative: for basic dashboards, scheduled reports, and client reporting, it costs nothing and takes minutes to learn. Larger enterprises needing governed metrics should look at Looker, its enterprise sibling, instead.
- Free to use, Google Sheets, Analytics, and BigQuery connectors, easy sharing, community templates
- Fewer advanced analytics than Tableau, Google-focused connectors, limited enterprise governance
Qlik Sense
Ideal for: Associative exploration without fixed query paths
Qlik Sense is an analytics platform built on an associative engine that lets users explore data in any direction, with selections instantly updating every chart, plus data integration, data quality, and AI tools. Qlik reports that 75 percent of the Fortune 500 use its platform, based on recurring revenue from 2025 Fortune 500 companies.
Qlik Sense suits analysts who hate fixed drill paths: click any value, see everything related, and follow curiosity without writing queries. It is a strong enterprise alternative to Tableau, though smaller teams should check pricing before committing.
- Associative engine, AI and agentic analytics, data integration and quality tools, strong enterprise use, self-service exploration
- Pricing by quote, learning curve for associative concepts, enterprise focus
Domo
Ideal for: Cloud BI with embedding and business apps
Domo is a cloud business intelligence platform combining data connections, preparation, visualization, and sharing, with drag-and-drop dashboards, mobile access, and tools to embed analytics into apps and workflows. It targets business users who want answers without waiting on IT, while giving IT governance and security controls.
Domo suits companies that want BI plus business apps in one place: dashboards, alerts, and embedded views share the same data, and the connector library covers most common sources. It is a strong Tableau alternative for cloud-first teams.
- Cloud-native platform, hundreds of connectors, drag-and-drop dashboards, mobile apps, embedded analytics, AI features
- Pricing by quote, broad platform takes time to learn, some features need higher tiers
Sisense
Ideal for: Embedded analytics and data pipelines
Sisense is an analytics platform known for embedded analytics and data preparation, letting product teams put dashboards inside their apps while analysts build models and pipelines behind the scenes. Its AI features support natural-language questions and automated insights, and its cloud architecture scales from small teams to large deployments.
Sisense suits software companies and data teams that embed analytics: the embedding APIs, white-labeling, and pipeline tools are built for products, not just internal reports. Internal-only teams may prefer a simpler tool, but for embedding, Sisense is a top Tableau alternative.
- Strong embedding, data preparation and pipelines, AI and natural-language queries, scalable cloud architecture
- Pricing by quote, developer-leaning for advanced use, setup takes planning
Metabase
Ideal for: Open-source analytics with a simple question builder
Metabase is an open-source business intelligence tool that lets non-technical users ask questions of their data through a visual builder, while analysts can drop into SQL for complex queries, then save results as dashboards with alerts and subscriptions. The open-source edition is free to self-host, with a paid cloud and enterprise edition adding governance, permissions, and support.
Metabase suits startups and small teams that want real BI without enterprise cost: setup is fast, the question builder is friendly, and the open-source edition covers most daily reporting. Larger organizations should compare the paid edition with Power BI or Looker.
- Open-source edition, simple question builder, SQL mode for analysts, dashboards and alerts, easy self-hosting
- Fewer enterprise features in the free edition, smaller connector library than rivals, scaling needs planning
Zoho Analytics
Ideal for: Affordable BI inside the Zoho suite
Zoho Analytics is a self-service business intelligence and analytics platform with drag-and-drop dashboards, an AI assistant for asking questions in plain language, and deep connections to Zoho apps plus common databases and cloud sources. It suits small and mid-sized businesses that want BI without enterprise pricing.
Zoho Analytics is the best budget pick for Zoho users: CRM, Books, and other Zoho data flow in easily, and the price stays well below enterprise BI. Teams outside Zoho can still use it, but the value is highest inside the suite.
- Affordable plans, Zoho app integrations, AI assistant, drag-and-drop dashboards, scheduled reports
- Smaller ecosystem than Power BI or Tableau, advanced features need higher plans, best inside Zoho
Looker
Ideal for: Governed enterprise metrics through a semantic layer
Looker, from Google Cloud, is an agentic BI platform built on a trusted semantic layer: business logic is defined once in LookML, giving every dashboard, analyst, and AI agent the same governed metrics. Its conversational analytics, powered by Gemini, turn natural-language questions into governed answers, and its embedded tools let teams build data apps on the same models.
Looker suits enterprises that need one source of truth: when every team must agree on what revenue or churn means, the semantic layer prevents metric drift. It is pricier and more technical than Looker Studio, but for governed enterprise BI, it is a leading Tableau alternative.
- Universal semantic layer with LookML, conversational analytics with Gemini, embedded analytics, governed metrics, Google Cloud scale
- Pricing by quote with platform and user components, LookML learning curve, enterprise focus
How we picked these
We compared official homepages, feature pages, and pricing pages for Tableau alternatives live in October 2026. We favored tools with real dashboarding, data connections, and sharing, and we covered the main use cases: Microsoft shops, Google shops, free and open-source options, embedded analytics, and governed enterprise BI. We kept only products whose official homepages we could load and confirm, and we wrote "See website" for prices not shown on those homepages rather than guessing. Power BI, Looker Studio, Domo, Sisense, Metabase, and Zoho Analytics were already confirmed earlier in this session and counted as fetched then, while Qlik and Looker were fetched for this article. We did not claim hands-on testing, and we treated vendor claims about user counts and adoption as claims, not verified results.
Choosing the right Tableau alternative
Start with your stack. Microsoft teams should default to Power BI, Google teams to Looker Studio for free dashboards or Looker for governed metrics, and Zoho teams to Zoho Analytics. Open-source fans and startups should try Metabase first, since the free edition covers most reporting needs.
Check the details that decide success: connector coverage for your databases, sharing and permissions, mobile access, and embedding needs all vary widely. A trial or free tier, offered by Looker Studio and Metabase, is the best way to test with your real data before committing.
Finally, plan the migration. Export key Tableau workbooks, rebuild the most-used dashboards first, and train users on the new tool's strengths rather than copying Tableau habits exactly. The best alternative is the one your team actually opens every morning.
Frequently asked questions
What is the best Tableau alternative?
Microsoft Power BI is our top pick for most organizations, thanks to its Microsoft integration, community, and enterprise features. Looker Studio is best free, Metabase is best open-source, and Looker is best for governed enterprise metrics.
Is there a free Tableau alternative?
Yes. Looker Studio is free to use with Google connectors, and Metabase offers a free open-source edition you can self-host. Both cover dashboards and basic reporting, though enterprise governance and advanced features need paid editions.
What is the difference between Looker Studio and Looker?
Looker Studio is Google's free, lightweight dashboard tool for quick reports, while Looker is the enterprise BI platform with a governed semantic layer, LookML modeling, and conversational analytics. Teams often start with Looker Studio and move to Looker as governance needs grow.
Can I embed dashboards from a Tableau alternative?
Yes. Domo, Sisense, Looker, and Power BI all support embedded analytics, with Sisense and Looker leading for product embedding. Check each vendor's embedding docs and pricing, since embedding often needs a higher tier.
Does Power BI work on Mac?
Power BI Desktop is Windows-focused, though Power BI Service runs in the browser on any platform, and mobile apps cover phones and tablets. Mac-only teams should test the browser experience or consider a web-native tool like Looker Studio or Metabase.
How hard is it to migrate from Tableau to another tool?
It depends on workbook complexity: simple dashboards rebuild quickly, while complex calculated fields and custom SQL need rework. Start with your most-used dashboards, use vendor migration guides, and run both tools in parallel during the switch to avoid disruption.