Best Zenoss Alternatives in 2026: 8 Options Compared

- Datadog gives the widest cloud and application coverage, but its pricing can climb fast as you add hosts and features.
- Zabbix and LibreNMS are strong no-cost starting points for teams that are comfortable running their own monitoring server.
- PRTG and Checkmk suit infrastructure teams that want clear device monitoring without paying for a full observability suite.
- LogicMonitor and SolarWinds fit larger estates where central dashboards and alerting rules matter more than a low entry price.
Quick comparison
| Product | Ideal for | Price from | Free version | |
|---|---|---|---|---|
 Datadog | cloud and application monitoring | See website | Free trial | Visit |
 Zabbix | free open source monitoring | Free | Yes | Visit |
 Nagios XI | established infrastructure monitoring | See website | Free trial | Visit |
 PRTG Network Monitor | Windows-friendly network monitoring | See website | Free trial | Visit |
 Checkmk | hybrid infrastructure monitoring | See website | Yes | Visit |
 LibreNMS | free network device monitoring | Free | Yes | Visit |
 SolarWinds Observability | large hybrid estates | See website | Free trial | Visit |
 LogicMonitor | hosted infrastructure monitoring | See website | Free trial | Visit |
The best Zenoss Alternatives
Here are our picks for the best zenoss alternatives, covering a mix of well-known leaders and strong smaller options. We compared official feature pages, pricing pages, app-store listings, privacy policies and public reviews to build this list.
Datadog
Ideal for: cloud and application monitoring
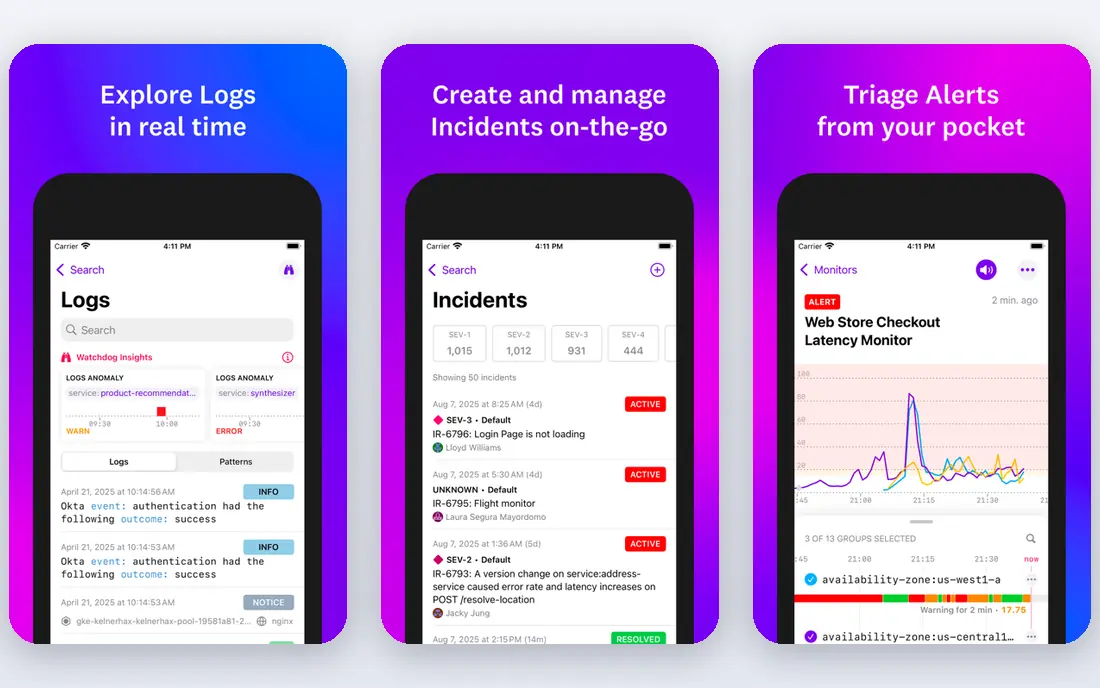
Datadog is the pick for teams whose infrastructure lives mostly in the cloud. It pulls together host metrics, container data, logs and application traces, so a team can follow a problem from a user-facing error down to the server or service behind it. The integration library covers the major cloud providers and popular databases, which cuts down the time spent wiring up new services.
The trade-off is cost and scope. Small teams that only need device uptime checks will pay for far more than they use, and the pricing model rewards careful planning around which hosts and features are enabled. Used with discipline, though, it replaces several separate tools with one consistent view of the whole estate.
Bottom line: Datadog suits cloud and application monitoring best. Its strongest point is broad cloud, container and application coverage, while the main drawback to weigh is pricing rises with hosts and data volume. Check the current pricing page before deciding, since plans and limits change.
- Broad cloud, container and application coverage
- Strong dashboards and alerting
- Large integration library
- Pricing rises with hosts and data volume
- Can feel complex for simple infrastructure monitoring
Zabbix
Ideal for: free open source monitoring
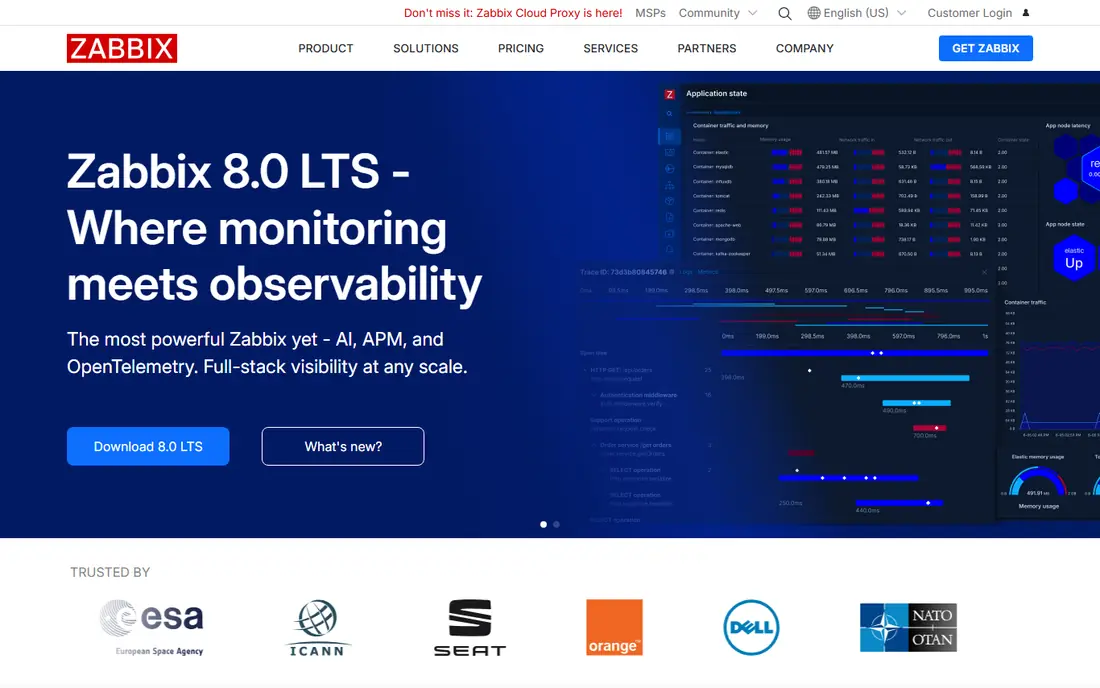
Zabbix has been a workhorse of infrastructure monitoring for years, and it remains one of the most capable free options available. It monitors servers, switches, virtual machines and applications, and its template system means common devices can be added with sensible checks already in place. Alerting is flexible, with escalation rules and multiple notification channels.
The catch is the work involved. Your team installs it, secures it, updates it and tunes it. That suits organisations with in-house skills and a tight budget, but it is a poor fit for a team that wants monitoring to simply run itself. If you can staff it, Zabbix covers a lot of ground for no licence fee.
Bottom line: Zabbix suits free open source monitoring best. Its strongest point is no licence cost, while the main drawback to weigh is needs a server and regular maintenance. Check the current pricing page before deciding, since plans and limits change.
- No licence cost
- Covers servers, networks and services
- Flexible alerting and templates
- Needs a server and regular maintenance
- Setup takes longer than hosted tools
Nagios XI
Ideal for: established infrastructure monitoring
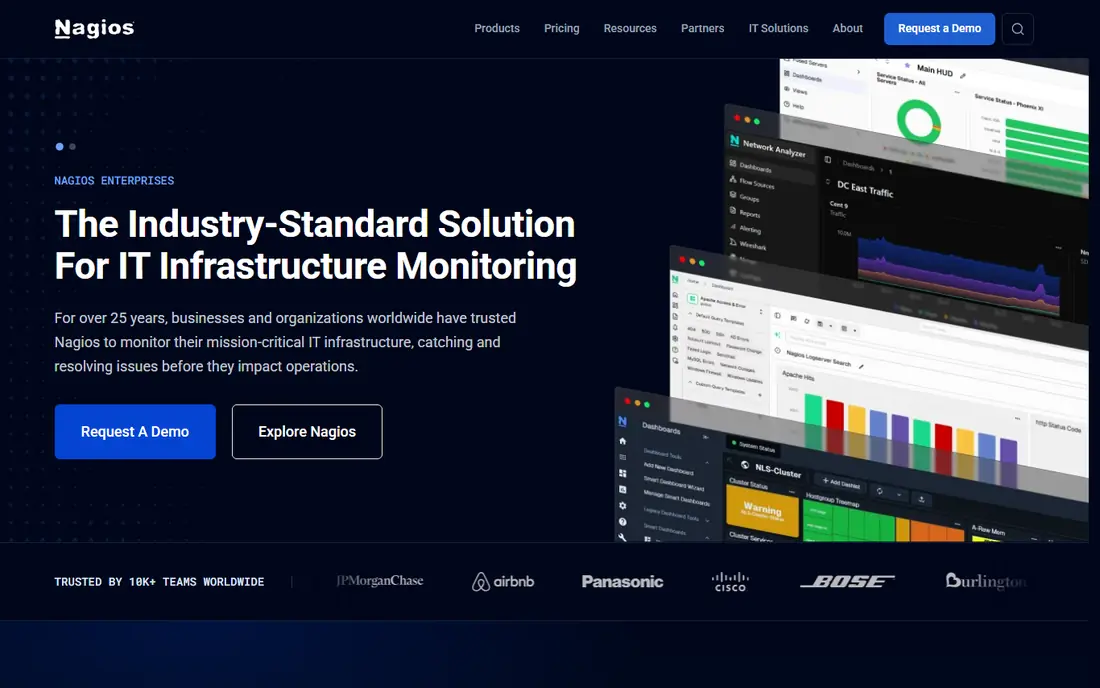
Nagios XI builds on the Nagios Core engine that many IT teams already know, adding a web interface, configuration wizards and reporting on top. Its plugin library is one of the largest in monitoring, so unusual devices and applications usually have an existing check. For teams that value a known, stable tool over a flashy interface, that history counts for a lot.
The interface shows its age compared with newer dashboards, and some reporting and graphing features arrive through add-ons rather than in the core product. Pricing is quoted per node, so ask for a figure based on your full estate. It remains a solid choice for traditional server and network monitoring.
Bottom line: Nagios XI suits established infrastructure monitoring best. Its strongest point is long track record, while the main drawback to weigh is interface feels dated. Check the current pricing page before deciding, since plans and limits change.
- Long track record
- Large plugin library
- Clear host and service status views
- Interface feels dated
- Advanced features often need add-ons
PRTG Network Monitor
Ideal for: Windows-friendly network monitoring
PRTG is popular with small and mid-size IT teams because it gets useful results quickly. Automatic discovery finds devices on the network, and sensors cover ping, traffic, CPU, disk and common services without a long configuration project. Maps and dashboards give a readable view of the whole network, which helps when explaining problems to non-technical managers.
PRTG runs on Windows, which matters if your team is Linux-only. Pricing is based on sensor count, and a busy network can use sensors faster than expected, so count carefully during the trial. For a team that wants monitoring running this week rather than next quarter, it is one of the easiest options here.
Bottom line: PRTG Network Monitor suits Windows-friendly network monitoring best. Its strongest point is fast setup with auto-discovery, while the main drawback to weigh is windows server required. Check the current pricing page before deciding, since plans and limits change.
- Fast setup with auto-discovery
- Sensor-based pricing
- Clear maps and alerts
- Windows server required
- Sensor limits can push costs up on large networks
Checkmk
Ideal for: hybrid infrastructure monitoring
Checkmk watches servers, networks, cloud hosts and containers from one console, and its discovery process is genuinely quick. It spots services on a host automatically and suggests sensible checks, which reduces the manual work that slows down other tools. The free Raw Edition covers a lot of monitoring needs without any licence cost.
The paid editions add reporting, business intelligence views and high-availability options that larger teams will want. The interface is functional rather than polished, and new users need a few days to learn its way of organising hosts and rules. For teams that want open source flexibility with a supported upgrade path, Checkmk is a balanced choice.
Bottom line: Checkmk suits hybrid infrastructure monitoring best. Its strongest point is free edition available, while the main drawback to weigh is enterprise features need a paid edition. Check the current pricing page before deciding, since plans and limits change.
- Free edition available
- Fast auto-discovery
- Good for servers and networks
- Enterprise features need a paid edition
- Interface takes time to learn
LibreNMS
Ideal for: free network device monitoring
LibreNMS is built for network monitoring, and it shows. It discovers switches, routers and firewalls automatically, collects interface traffic and device health, and alerts when a device or link goes down. For a network team that mainly needs to know the state of its hardware, it does that job well and costs nothing in licences.
It is less suited to deep application or log monitoring, so teams that need both may pair it with another tool. Support comes from the community rather than a vendor contract, which is fine for skilled teams but worth noting for organisations that need guaranteed response times. As a free network monitor, it is hard to beat.
Bottom line: LibreNMS suits free network device monitoring best. Its strongest point is no licence cost, while the main drawback to weigh is focused on network gear rather than applications. Check the current pricing page before deciding, since plans and limits change.
- No licence cost
- Strong network device support
- Automatic discovery
- Focused on network gear rather than applications
- Community support only
SolarWinds Observability
Ideal for: large hybrid estates
SolarWinds has a long history in network management, and its observability offering brings network, server, database and application data into one view. Teams that already use SolarWinds network tools will find familiar workflows, and the breadth of coverage suits estates that mix on-premises hardware with cloud services.
The product range is broad, which can make it hard to tell which edition fits a given need, so get a scoped quote rather than guessing from the website. Costs rise with scale, and smaller teams may find simpler tools better value. For large, mixed estates with an existing SolarWinds footprint, it is a natural alternative to consider.
Bottom line: SolarWinds Observability suits large hybrid estates best. Its strongest point is wide device and application coverage, while the main drawback to weigh is pricing can be high at scale. Check the current pricing page before deciding, since plans and limits change.
- Wide device and application coverage
- Mature network tools
- Central dashboards
- Pricing can be high at scale
- Product range can be confusing
LogicMonitor
Ideal for: hosted infrastructure monitoring
LogicMonitor is a hosted platform, which removes the server maintenance that comes with open source tools. It monitors servers, networks, cloud resources and applications, with alerting rules that can be tuned per device group. The hosted model suits teams that want monitoring without another system to look after.
Pricing is subscription based and depends on the resources monitored, so larger estates should expect a meaningful monthly bill. Custom dashboards and alert rules take some learning, though the documentation is solid. For teams that want a managed service with broad coverage, LogicMonitor is a strong contender.
Bottom line: LogicMonitor suits hosted infrastructure monitoring best. Its strongest point is hosted, so no server to run, while the main drawback to weigh is subscription cost adds up. Check the current pricing page before deciding, since plans and limits change.
- Hosted, so no server to run
- Broad device coverage
- Strong alerting
- Subscription cost adds up
- Some customisation needs learning
How we picked these
We started from the original product and what people use it for, then compared official feature pages, pricing pages, app-store listings, privacy policies and public reviews for each candidate. We kept only products that exist, work in October 2026 and genuinely fit the topic, and we left out products that were discontinued, unrelated or too thin to recommend.
We weighed fit for the topic first, then price and free options, ease of setup and the honest downsides that show up in reviews and documentation. Prices are given as listed on the vendor's own site where we could verify them, and we wrote See website where a price was quoted, unclear or likely to change by plan.
We also left out products that no longer exist, that have been folded into a different product, or that only partly fit the topic. A longer list would have been easier to write, but a list padded with poor fits helps nobody choose, so we kept the list to products we can genuinely recommend for this use.
How to choose a monitoring platform
Start by listing what you actually need to watch. A team that runs mostly servers and switches has different needs from a team that also tracks cloud services, containers and application traces. Buying a full observability suite for simple uptime checks wastes money, while a basic monitor will frustrate a team that needs deep application data.
Next, check how pricing scales. Some tools charge per host, some per sensor and some by data volume. Ask for a quote based on your real device count, not a demo environment. A free trial on your own network tells you more than any sales page, because alert noise and dashboard setup only show up with real data.
Finally, weigh the work of running the tool itself. Open source options cost nothing in licences but need someone to install, update and tune them. Hosted tools cost more each month but remove that burden. Pick the balance your team can actually maintain over a full year.
Run a real trial before you pay. Sign up for the free tier or trial, connect it to a real project, and test the exact tasks you do every week rather than the demo workflow. Check how long setup takes, how clear the reporting is and how quickly support replies, since those details decide whether a tool survives past the first month.
Plan the switch, not just the signup. Export your data from the old tool, check what imports cleanly and what must be rebuilt by hand, and keep the old system running until the new one has handled real work. A short overlap period avoids lost data and gives your team time to learn the new workflow.
Frequently asked questions
What is the best free Zenoss alternative?
Zabbix and LibreNMS are the most capable free options, and both cover servers, network devices and services with alerting. Zabbix needs more setup time, while LibreNMS is quicker to get going for network gear. Either one needs a server to run on and someone to keep it updated.
Is Datadog a good replacement for Zenoss?
Datadog works well for teams moving to cloud infrastructure, since it covers hosts, containers, logs and application traces in one place. It is usually more expensive than Zenoss for large device counts, so compare quotes carefully before switching.
Which alternative is easiest to set up?
PRTG is often the fastest to get running on Windows networks, with automatic discovery and sensor-based setup. Checkmk also offers a quick start, and both give you a working dashboard within a day in most small environments.
Do any of these tools monitor cloud services?
Yes. Datadog, LogicMonitor and SolarWinds all cover major cloud platforms alongside on-premises gear. Zabbix and Checkmk can monitor cloud hosts too, but they need more manual configuration for cloud-specific metrics.
Can I migrate my existing Zenoss alerts?
Most tools let you recreate alert rules and notification channels by hand, but there is no one-click import from Zenoss in most cases. Plan a short overlap period where both systems run, so you can compare alerts before switching off the old setup.
Can I try these options before paying?
Yes, in most cases. Nearly every option on this list offers a free tier or a free trial, and we note that in the comparison table and in each product block. Use the trial for real work rather than a quick look, and check the renewal price before the trial ends so there are no surprises.