For scripted statistics, data manipulation and reporting, Stata is where this list starts. Listed starting prices: OriginPro from $460. SPSS Statistics is better for guided analysis and predictive modeling, and OriginPro is better for Publication-quality graphing with analysis. All 5 tools are compared below on price, free plan and limits.
Best for: Scripted statistics, data manipulation and reporting
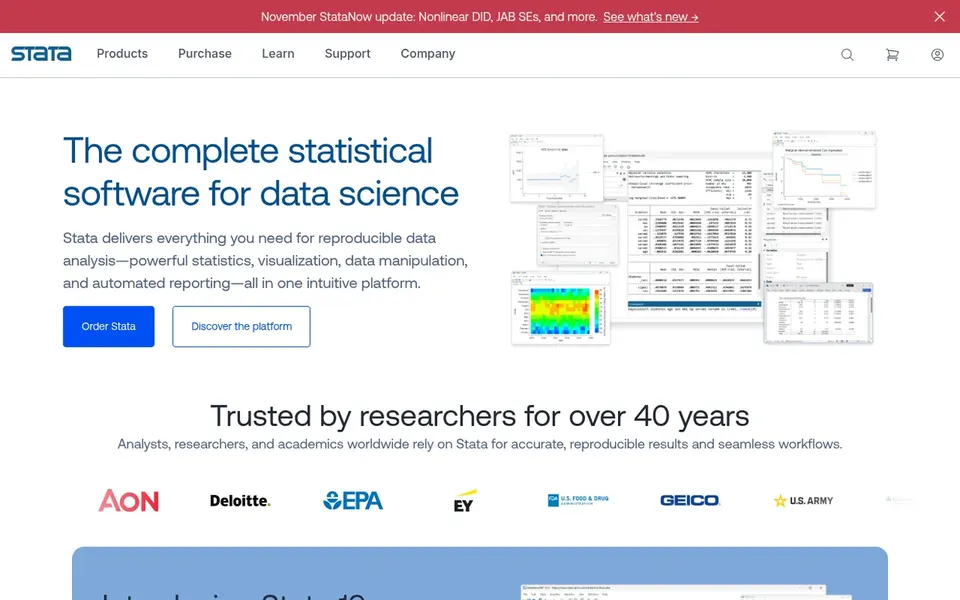
Pick Stata if this describes you: scripted statistics, data manipulation and reporting. Stata describes itself as a complete, integrated statistical package handling statistics, visualization, data manipulation and reporting, and it emphasizes speed, accuracy and simplicity.
Reasons to shortlist it: Complete integrated package.
Beyond that, users who chiefly want drag-and-drop exploration may prefer JMP or SPSS Statistics. Since commands drive most work, beginners may find the initial ramp-up time steeper than a purely menu-based tool. This comparison lists no price for Stata; ask the vendor. As for free access: Not stated.
Trade-offs to know: Less emphasis on interactive graphing.
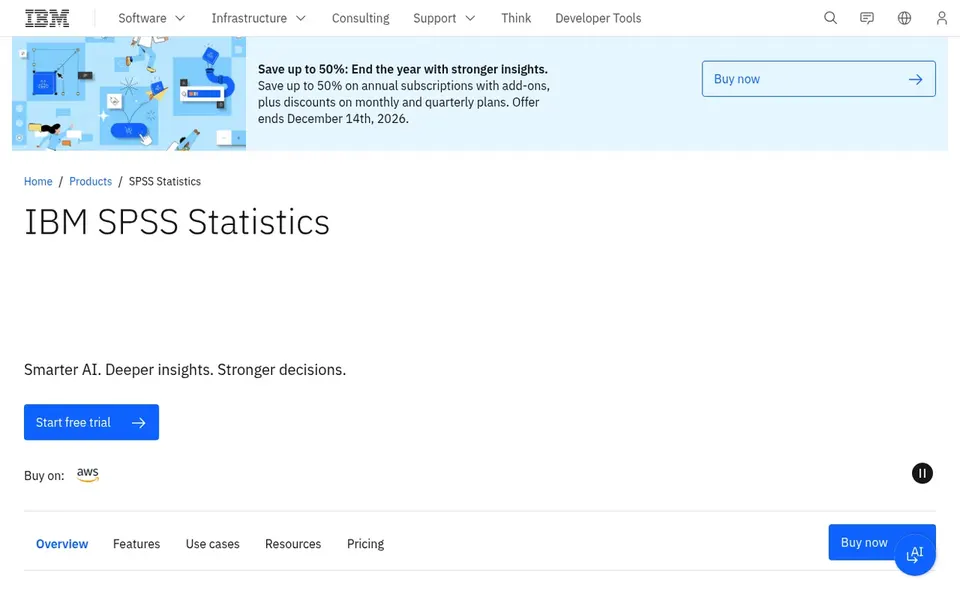
SPSS Statistics is a good fit for guided analysis and predictive modeling. Organizations that valued Minitab's guided menus but need broader predictive modeling frequently place SPSS high on their list. More specifically, check which procedures and extras you actually need on the vendor page.
Where it is weaker: Large feature set takes time to navigate.
The breadth of features can overwhelm new users, and analysts who prefer full control through code may find the menu approach limiting compared to RStudio or Stata. It also tends to suit structured, conventional examines more than highly customized pipelines. SPSS Statistics does not show a starting price in this comparison, so check the vendor site for current pricing. Free options: Not stated.
Best for: Publication-quality graphing with analysis
Think of OriginPro for Publication-quality graphing with analysis. If Minitab felt weak on publication-ready graphics, OriginPro addresses that gap straight. Its strength in graphing means the statistical toolkit is less deep than in packages built purely for statistics, so advanced modeling may need another tool.
Reasons to shortlist it: Capable data analysis and graphing focus.
What to check first: Statistical breadth narrower than dedicated packages.
As for the details, confirm that the specific examines you need are supported before relying on it alone. Worth adding: analysts centred on inference instead of figures may prefer Stata or SPSS Statistics. Entry price for OriginPro: $460. Free plan details: Not stated.
Best for: Engineers and scientists exploring data visually
JMP targets engineers and scientists exploring data visually. JMP is statistical discovery software built with scientists and engineers in mind, though the vendor positions it for anyone solving problems with data. Confirm module coverage on the vendor site before committing.
Points against: Interface takes time to learn.
Where JMP stands out: exploratory approach.
Teams that primarily need survey statistics or heavy syntax work may prefer SPSS Statistics or Stata. If your Minitab work leaned on design of experiments and interactive charts, JMP is a natural place to start your shortlist. As for the details, the trade-off is a ramp-up time: JMP's exploratory style differs from menu-driven packages. Users coming from strict script-based tools may find it less adaptable for custom coding. JMP shows no starting price here, so confirm the cost on the vendor site. As for free access: Not stated.
Best for: Open-source R coding with multi-language support
RStudio serves open-source R coding with multi-language support. It suits analysts and statisticians who are willing to write code in exchange for adaptability and reproducibility.
What users get: SQL and other languages.
There is no point-and-click path to most examines, so users without coding experience will need training or support. RStudio does not show a starting price in this comparison, so check the vendor site for current pricing. As for free access: Not stated.
Get a written quote from Stata, SPSS Statistics, JMP and RStudio; the list shows no starting price for them.
Before choosing Stata, weigh its main limit: command syntax is central, so expect a ramp-up time.
Confirm that RStudio connects to the apps your team already uses, on the plan you would actually buy.
Map your must-have features to a specific JMP plan before you compare prices.
Check how data leaves SPSS Statistics: formats, limits and whether exports are available on every plan.
How we picked
Selection started from tools commonly considered for Minitab, then narrowed to 5 that have clear pricing information or a clear quote process. Plan names, prices and limits change often. Treat the figures here as a starting point and verify them with the vendor. We ordered the tools by general fit, then by how clearly pricing is shown, then by free access. A buyer with unusual needs may reorder them.
Every price and plan detail on this page comes from the vendors’ own websites. We did not run hands-on tests unless the text says so, and we do not publish star ratings or review scores. See how we score and our disclosure.
Keep your shortlist in one place
Paste prices, trial dates and notes from this guide into Ainotely, our AI note app. It files them into a topic and pulls out tasks like “cancel trial by Friday”. Free 7-day trial, no card needed.
Is Stata the right pick for everyone comparing Minitab?
No single tool suits every team. Stata comes first because it fits scripted statistics, data manipulation and reporting, while SPSS Statistics suits guided analysis and predictive modeling and OriginPro suits Publication-quality graphing with analysis. Match the tool to your own size, budget and workflow before deciding.
Does any tool for Minitab here have a free plan?
No tool in this list, Stata and RStudio included, has a permanent free plan. Trials and quotes are the usual route, so plan a short evaluation period.
Which Minitab alternative is easiest for beginners?
SPSS Statistics and JMP offer the most guided, menu-driven experiences, which helps users without coding backgrounds. RStudio needs scripting in R, so it is better suited to teams with programming skills.
Can I try these tools before paying?
Not by default. None of the tools, from Stata to RStudio, lists a free plan or a free trial here, so ask each vendor for a demo before committing.
How are the tools for Minitab ordered?
Stata sits first and RStudio last because the order follows typical fit for Minitab, then price clarity and free access. It is a judgement call, so read each profile for fit and limits.