This list puts TIBCO Spotfire first for complicated industry-specific visual analysis. Listed starting prices: Tableau from $15 per user a month. If your case is different, Sisense suits embedding analytics into products and Zoho Analytics suits teams already using Zoho apps. The full list of 5 tools follows, with prices and free plan facts.
Ainotely compared 5 tools for data visualization software for excel. The goal is a practical shortlist: published prices, free plan facts, best-fit use cases and honest limits for every entry.
Key takeaways
TIBCO Spotfire takes the first slot, best suited to complex industry-specific visual analysis.
For governed data and AI-ready pipelines, Domo is worth a look.
What to know about Tableau first: can feel complicated for new users.
Only Tableau offers a free plan among these 5 tools.
For the cheapest start, look at Tableau: $15 per user per month.
Best for: Complicated industry-specific visual analysis
TIBCO Spotfire is designed for complex industry-specific visual analysis. Excel users who require more than charts, like deeper statistical exploration, may find the combination handy. From a buyer's view, the system is oriented toward complicated problems, so casual users may find it more than they need for routine reporting.
Also, advanced analytics features take time to learn. More specifically, consider a more straightforward dashboard tool if your work stays with entry-level charts and summaries. No starting price is listed for TIBCO Spotfire here; confirm pricing on the vendor site. Trial and free access: Not stated.
Drawbacks to consider: Industry focus may be more than needed.
Think of Sisense for embedding analytics into products. Sisense gives AI-powered embedded analytics, aiming to turn data into revenue with pro-code, low-code and no-code flexibility.
That makes it relevant for Excel users whose spreadsheets feed a product, portal or internal application that needs charts built in. In practice, since the product is built around embedding, teams that simply want to chart Excel files may find the focus mismatched. This comparison lists no price for Sisense; ask the vendor. Free plan details: Free trial.
What to check first: Embedding focus may not suit plain reporting.
Zoho Analytics makes the most sense for teams already using Zoho apps. Its homepage flags connecting to numerous apps, building dashboards, and getting actionable insights rapidly. Advanced needs may call for a more specialized system.
For everyday use, the most solid fit is within the Zoho ecosystem. Teams using unrelated tools may not gain as much from its app connections. Check the vendor site for Zoho Analytics pricing; none is listed in this comparison. Trial and free access: Not stated.
The main drawbacks: Feature depth varies by use case.
Best for: Drag-and-drop visuals from numerous sources
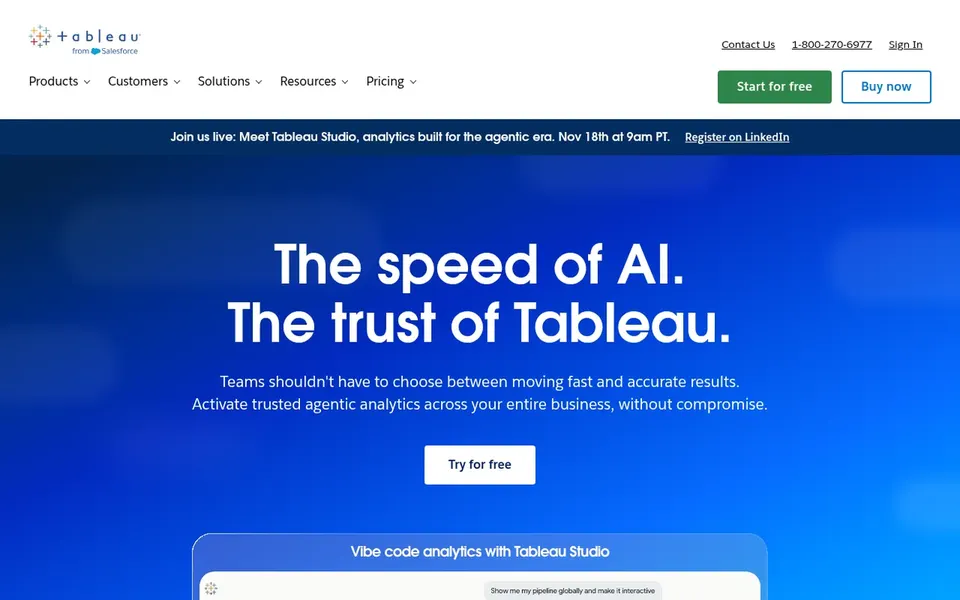
In short, Tableau is for drag-and-drop visuals from plenty of sources. Tableau is a business intelligence and analytics system built around seeing and understanding data.
Downsides: Can feel complicated for new users.
That makes it a natural step up for Excel users who want richer charts and interactive dashboards without writing code. Setup and learning take time, and more straightforward tools may be enough for entry-level reporting. Tableau starts at: $15 per user per month. A free plan is available with Tableau.
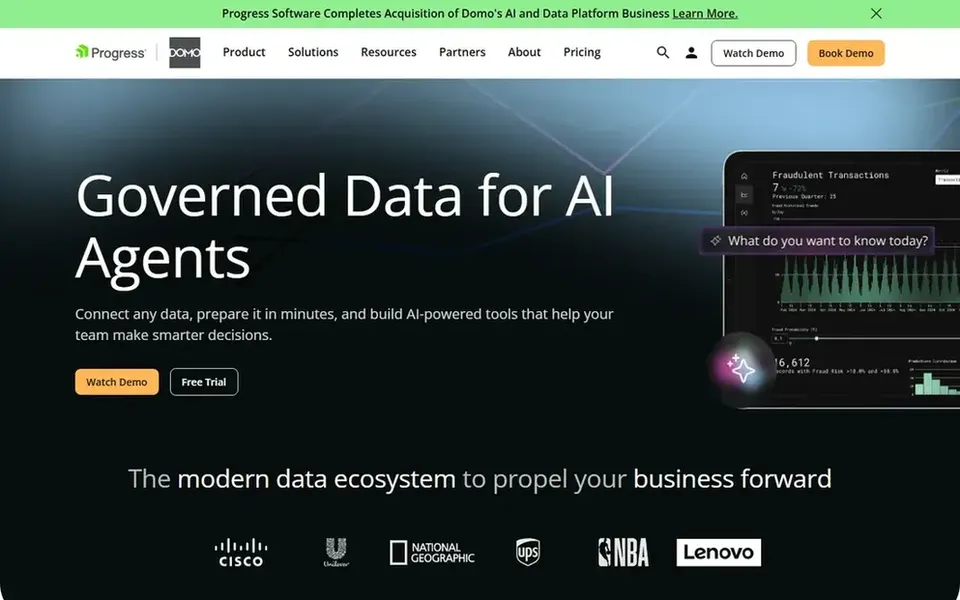
In short, Domo is for governed data and AI-ready pipelines. For Excel users, the appeal is a managed path from raw spreadsheets to business-critical insights without building pipelines by hand.
Understanding the data movement features takes some effort. Worth adding: Domo is a wide data product, so a user who chiefly wants to chart a single workbook may not need its full scope. Domo shows no starting price here, so confirm the cost on the vendor site. On free options: Free trial.
Where it is weaker: May be more than straightforward charting needs.
Get a written quote from TIBCO Spotfire, Sisense, Zoho Analytics and Domo; the list shows no starting price for them.
Look at the free plan from Tableau closely: its caps decide whether it is usable for real work.
Use real work to test the free trial from Sisense and Domo, rather than a demo project.
Before choosing TIBCO Spotfire, weigh its main limit: can be complicated for casual users.
Look at the renewal terms for Zoho Analytics: auto-renewal, notice periods and price changes can matter more than the first-year price.
Confirm you can export your data from Tableau, so leaving later does not mean losing records.
How we picked
Each tool was reviewed on what its vendor publishes: price, plan limits, core features and stated drawbacks. We did not run hands-on tests. Where a price is missing, the vendor does not list one publicly or ties it to a quote. Always confirm before budgeting. The ranking is editorial: typical fit first, then clear pricing, then free access. If your needs are unusual, read the profiles rather than relying on position. Keep it in mind while reading the 5 data Visualization software for Excel profiles on this page.
Every price and plan detail on this page comes from the vendors’ own websites. We did not run hands-on tests unless the text says so, and we do not publish star ratings or review scores. See how we score and our disclosure.
Keep your shortlist in one place
Paste prices, trial dates and notes from this guide into Ainotely, our AI note app. It files them into a topic and pulls out tasks like “cancel trial by Friday”. Free 7-day trial, no card needed.
Is TIBCO Spotfire the right pick for everyone comparing data visualization software for excel?
No single tool suits every team. TIBCO Spotfire comes first because it fits complex industry-specific visual analysis, while Sisense suits embedding analytics into products and Zoho Analytics suits teams already using Zoho apps. Match the tool to your own size, budget and workflow before deciding.
When is an embedded analytics tool the right choice?
Embedded analytics makes sense when charts have to live inside your own product, portal or application instead of a standalone dashboard. If you only need internal reporting, a standard dashboard tool is typically more straightforward.
Do these tools publish their prices?
Not all of them. TIBCO Spotfire, Sisense, Zoho Analytics and Domo publish no starting price, so expect a quote request for those. The rest, Tableau included, show a starting price, though seats and billing terms still change the final cost.
Which options for data visualization software for excel have a free plan?
Tableau is the only tool in this list with a free plan. Free plans usually cap users, projects or features, so check the limits on the vendor page. Several others offer a trial instead. All 5 picks in this data Visualization software for Excel comparison show their pricing, free plan details and main limits on the cards above.
Which tool is a good match for visualizing Excel data rapidly?
TIBCO Spotfire is the pick this page puts first, mainly for complex industry-specific visual analysis. If your situation differs, Sisense suits embedding analytics into products, and Zoho Analytics suits teams already using Zoho apps. Compare price and limits before you decide.
What should I check before choosing a visualization tool?
Confirm the data sources it links to, how dashboards are shared, and whether you need data preparation or embedding features. Also check how much complexity your team can absorb. Review current capabilities on the vendor site before deciding.