For embedding analytics into learning products, Sisense is where this list starts. Listed starting prices: Tableau from $15 per user per month. If your case is different, Google Looker Studio suits fast shareable dashboards and reports and Tableau suits deep visual analysis and teaching. All 5 tools are compared below on price, free plan and limits.
Ainotely put together this guide to data visualization tools for educators for readers who want a clear shortlist without reading every vendor page. It compares 5 tools on starting price, free plans, who each one suits and where each one falls short.
Key takeaways
The list opens with Sisense, aimed at embedding analytics into learning systems.
Only Tableau offers a free plan among these 5 tools.
IBM Cognos Analytics fits AI-assisted reports and dashboards.
The main caution on Domo: wide product may overwhelm small courses.
The cheapest monthly starting price in the list is $15 per user per month, offered by Tableau.
Best for: Embedding analytics into learning systems
Think of Sisense for embedding analytics into learning systems. For educators, its relevance shows up when visualization needs to live inside another system, like a learning system or an institutional portal that presents data to students and staff. Educators who just want to visualize a dataset in class will likely prefer a direct dashboard tool.
The range of build choices lets technical and nontechnical teams work in the style that fits them. Consider Sisense when analytics must be woven into a broader digital experience. Check the vendor site for Sisense pricing; none is listed in this comparison. Free access: Free trial.
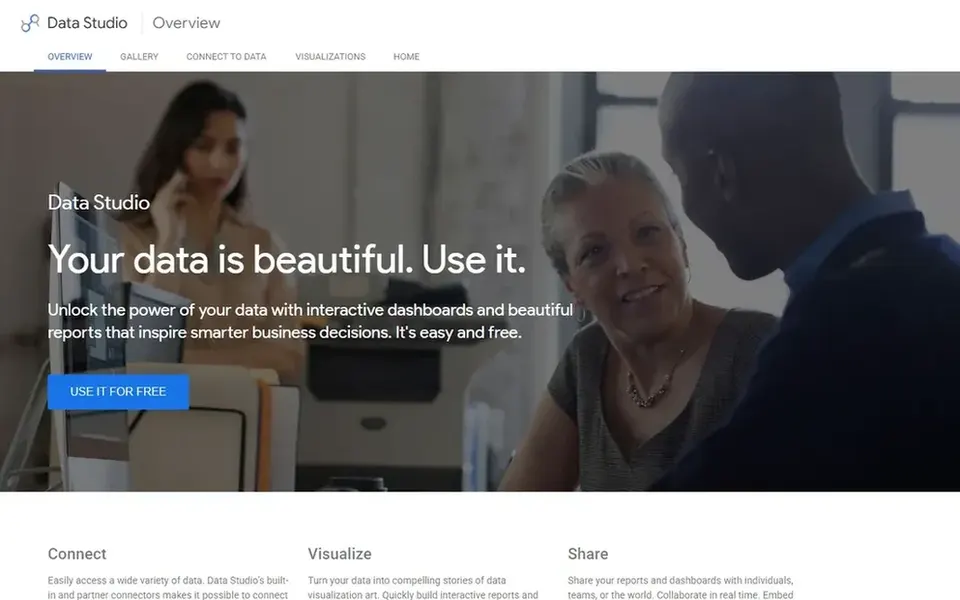
For fast shareable dashboards and reports, Google Looker Studio is a natural candidate. Google Looker Studio presents itself as a way to unlock data through interactive dashboards and reports meant to inspire smarter decisions.
Downsides: Design depth is restricted for advanced users.
Google Looker Studio shows no starting price here, so confirm the cost on the vendor site. Free access: Not stated.
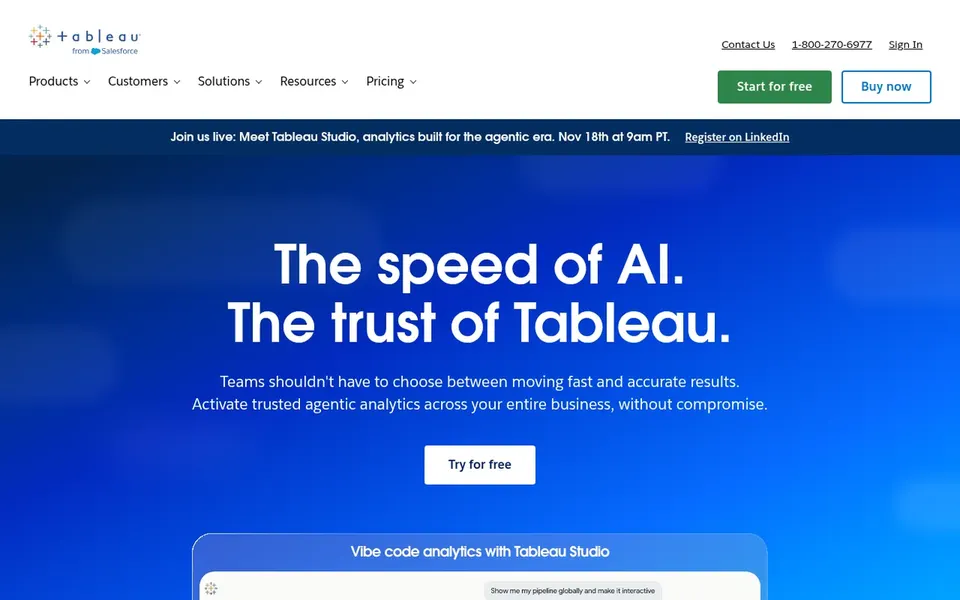
Tableau serves deep visual analysis and teaching. Tableau is a business intelligence and analytics system built around seeing and understanding data. Its documented approach lets users link to almost any database, then drag-and-drop to produce visualizations and share results with a click.
Limits to weigh: Full system may exceed straightforward classroom needs.
Worth adding: choose Tableau when visual exploration and data connections matter more than a minimal ramp-up time. More specifically, the breadth that makes Tableau feature-rich can also slow newcomers, since building effective views rewards practice with its interface. Price to start with Tableau: $15 per user per month. Tableau offers a free plan.
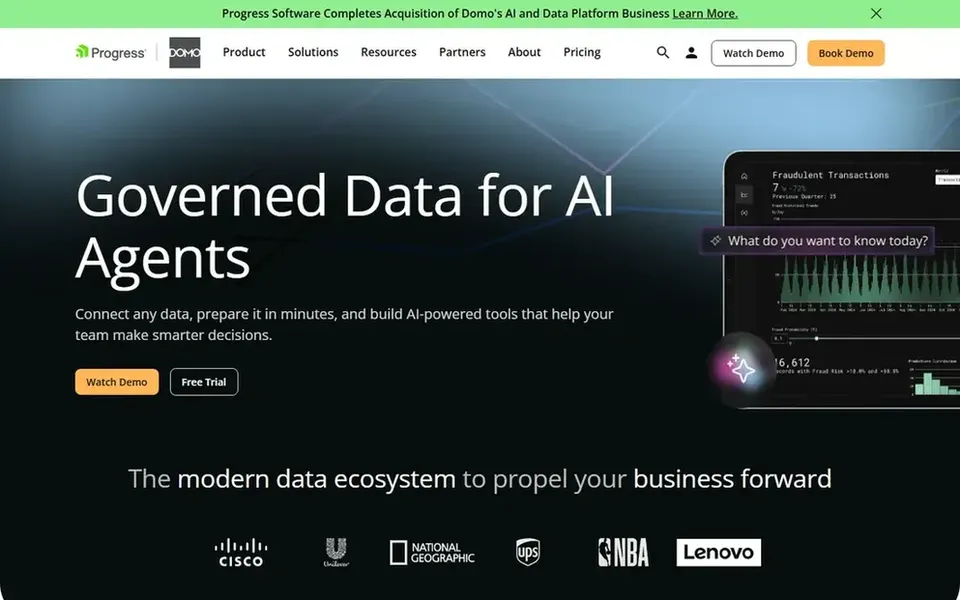
Domo was built for governed data across the institution. Consider it when governance and data movement matter, and look to more straightforward tools for single-course charting.
In practice, getting value relies on having data sources ready to link. No starting price is listed for Domo here; confirm pricing on the vendor site. On free options: Free trial.
Highlights: business-critical insights.
Trade-offs to know: Setup relies on institutional data infrastructure.
IBM Cognos Analytics is designed for AI-assisted reports and dashboards. Educators can apply it to institutional reporting or to courses that introduce students to professional analytics workflows.
Watch-outs: Enterprise orientation may feel formal.
Beyond that, instructors wanting instant charts may prefer a more straightforward dashboard tool. IBM Cognos Analytics shows no starting price here, so confirm the cost on the vendor site. Free access: Not stated.
Ask Sisense, Google Looker Studio, Domo and IBM Cognos Analytics for a written quote, since no starting price is shown.
Look at the free plan from Tableau closely: its caps decide whether it is usable for real work.
Use real work to test the free trial from Sisense and Domo, rather than a demo project.
Read the limits listed for Sisense first: embedding focus may not fit plain teaching.
Ask Tableau about contract length, onboarding fees and user minimums before you sign.
Involve the people who will use IBM Cognos Analytics daily; a short pilot beats a long feature checklist.
How we picked
Selection started from tools commonly considered for data visualization tools for educators, then narrowed to 5 that have clear pricing information or a clear quote process. Where a price is missing, the vendor does not list one publicly or ties it to a quote. Always confirm before budgeting. Position on the page reflects fit for a typical buyer first, with price clarity and free access breaking ties. Treat it as a guide, not a ruling.
Every price and plan detail on this page comes from the vendors’ own websites. We did not run hands-on tests unless the text says so, and we do not publish star ratings or review scores. See how we score and our disclosure.
Keep your shortlist in one place
Paste prices, trial dates and notes from this guide into Ainotely, our AI note app. It files them into a topic and pulls out tasks like “cancel trial by Friday”. Free 7-day trial, no card needed.
Is Sisense the right pick for everyone comparing data visualization tools for educators?
No single tool suits every team. Sisense comes first because it fits embedding analytics into learning platforms, while Google Looker Studio suits quick shareable dashboards and reports and Tableau suits deep visual analysis and teaching. Match the tool to your own size, budget and workflow before deciding.
Which options for data visualization tools for educators have a free plan?
Tableau is the only tool in this list with a free plan. Free plans usually cap users, projects or features, so check the limits on the vendor page. Several others offer a trial instead. Pricing, free plan details and limits for all 5 tools in this data Visualization tools for Educators roundup sit on the individual cards above.
How are the tools for data visualization tools for educators ordered?
The order follows typical fit for data visualization tools for educators, with Sisense first and IBM Cognos Analytics last, then price clarity and free access. It is editorial judgement, not a score, so another team could rank the tools differently.
What is the cheapest option for data visualization tools for educators in this list?
On published monthly entry prices, Tableau is the lowest here at $15 per user per month. Entry price is only part of the cost, because seats, add-ons and billing terms can change the total. The 5 tool cards above repeat this per product for data Visualization tools for Educators, with the listed price or "pricing on request".
How should I evaluate a tool before adopting it for a course?
List the data sources, chart types, and sharing needs for your course, then check each vendor's documentation against that list. A short trial with your own sample data is the most steady test.